Storm Before the Calm
Volatility in the global financial markets accelerated in the second quarter as investors, consumers, and policy makers alike faced opposing economic challenges: the rampant run of inflation and the looming threat of recession.
After three remarkable years of outsized returns in the stock market, the first half of 2022 was anything but. While prices of household goods and services climbed, prices of financial assets fell. The result has been a hit to both consumers’ wallets and balance sheets. With equities down 20 percent, and bonds—that typically act as a safe, diversifying asset—not faring much better, investors and consumers are navigating rough waters.
However, as we examine the factors that have brought us to this point, we must also consider a handful of financial and economic indicators that suggest the tide is beginning to turn.
Second Quarter Recap
U.S. financial markets suffered their worst mid-year outcome in more than 50 years. While the first quarter was certainly volatile—with single-digit declines across the investment landscape—losses accelerated during the second quarter, resulting in double-digit declines for nearly all major asset classes over the first half of 2022. Figure One summarizes asset class returns for the second quarter and first half 2022.
Figure One: Major Asset Class Returns
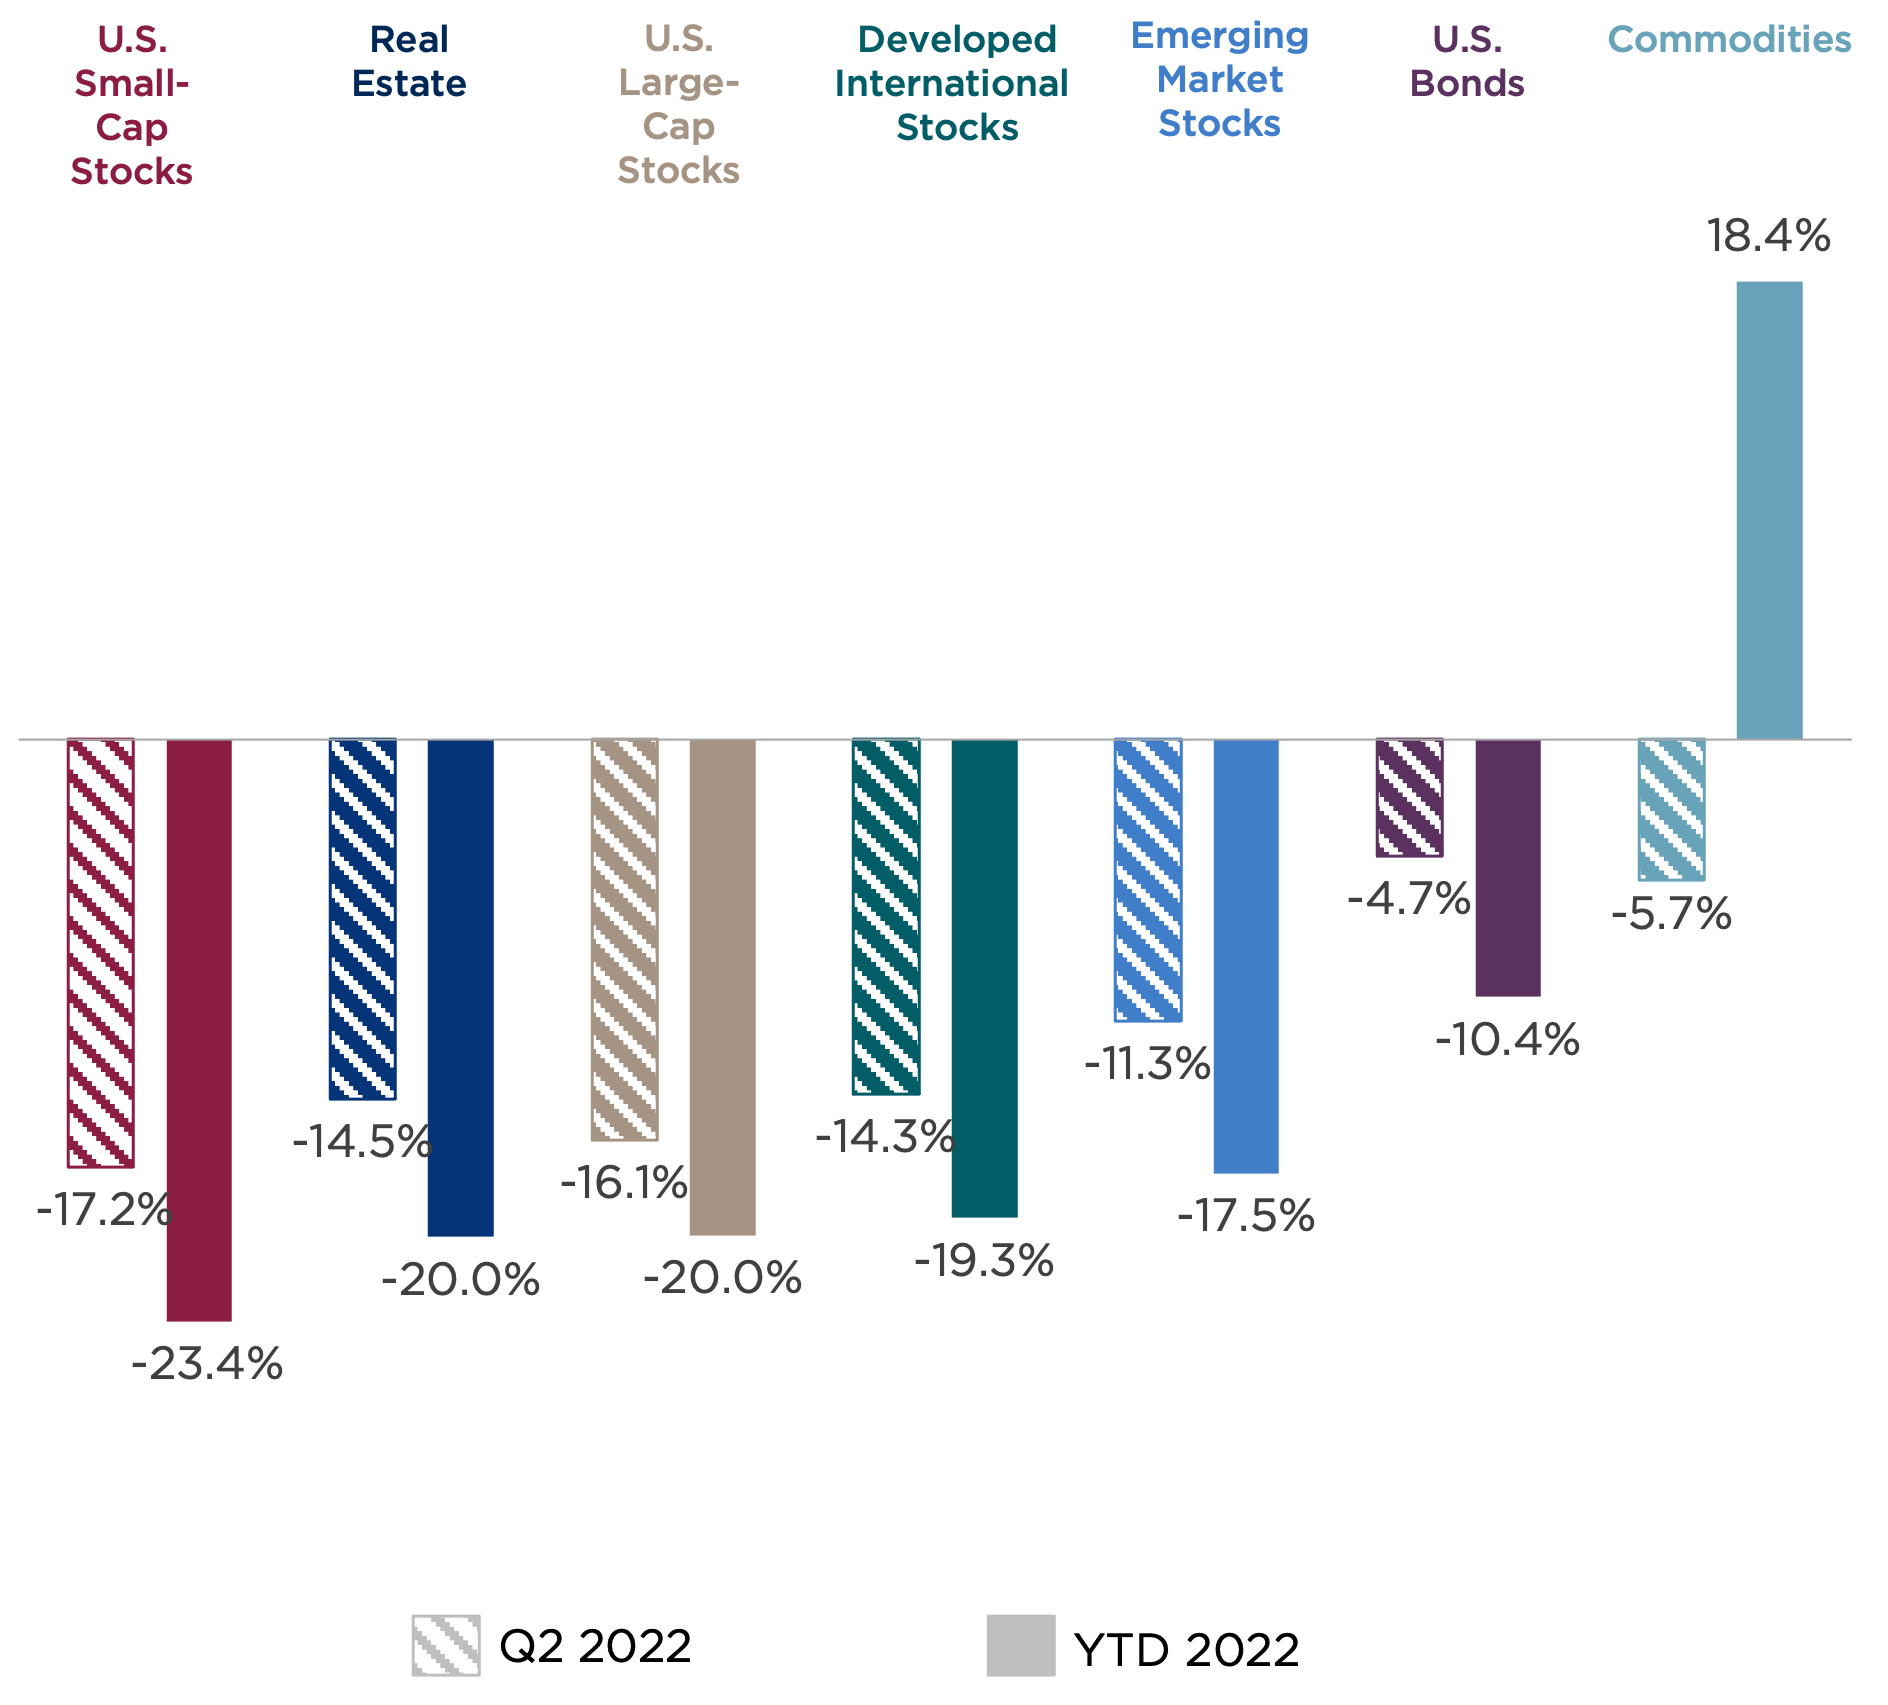
Sources: Bloomberg. Asset class returns are represented by the following indexes: Bloomberg U.S. Aggregate Bond Index (U.S. bonds), S&P 500 Index (large-cap stocks), Russell 2000® (small-cap stocks), MSCI EAFE Index (international stocks), MSCI Emerging Market Index (emerging market stocks), Dow Jones U.S. Real Estate Index (real estate), and Bloomberg Commodity Index (commodities).
- Despite a late-quarter bounce, U.S. large-cap stocks ended the second quarter down 16 percent, bringing year-to-date losses to 20 percent. Defensive sectors such as consumer staples and utilities fared best in the declining market, while growth-driven sectors, such as consumer discretionary and technology, were hardest hit.
- International stocks performed modestly better than their domestic counterparts. However, the dollar’s continued strength offset their relative advantage. Developed international stocks ended the quarter down 14 percent, while emerging market stocks closed down 11 percent.
- Bond prices remained under pressure as interest rates continued their ascent. For the quarter, the Bloomberg U.S. Aggregate Bond Index lost another 5 percent, bringing its midyear decline to 10 percent.
- Commodities have been the outlier in the first half, as higher demand and constrained supply boosted food, energy, and basic materials prices. However, even commodities pulled back 6 percent in the second quarter as increasing growth concerns offset these positive inflation pressures.
Shifting Inflation Narrative
After the first quarter of 2022, investors were facing a great deal of uncertainty. The timing and scale of the Federal Reserve’s response to inflation was unknown; the capabilities and ambitions of Russian’s military operations in Eastern Europe were undefined; and the transition of COVID-19 from pandemic to manageable endemic was still up in the air.
Amid these unknowns, the supply-demand imbalance was worsening as factory shutdowns in China and sanctions against Russian exports continued to disrupt global trade.
As the second quarter went on, many of these risks narrowed in scope. However, inflation expectations continued to climb with each new hurdle presented to the markets—that is, until recently, when an aggressive Fed policy stance reversed market sentiment, as suggested in Figure Two below.
Figure Two: Five-Year Inflation Expectations
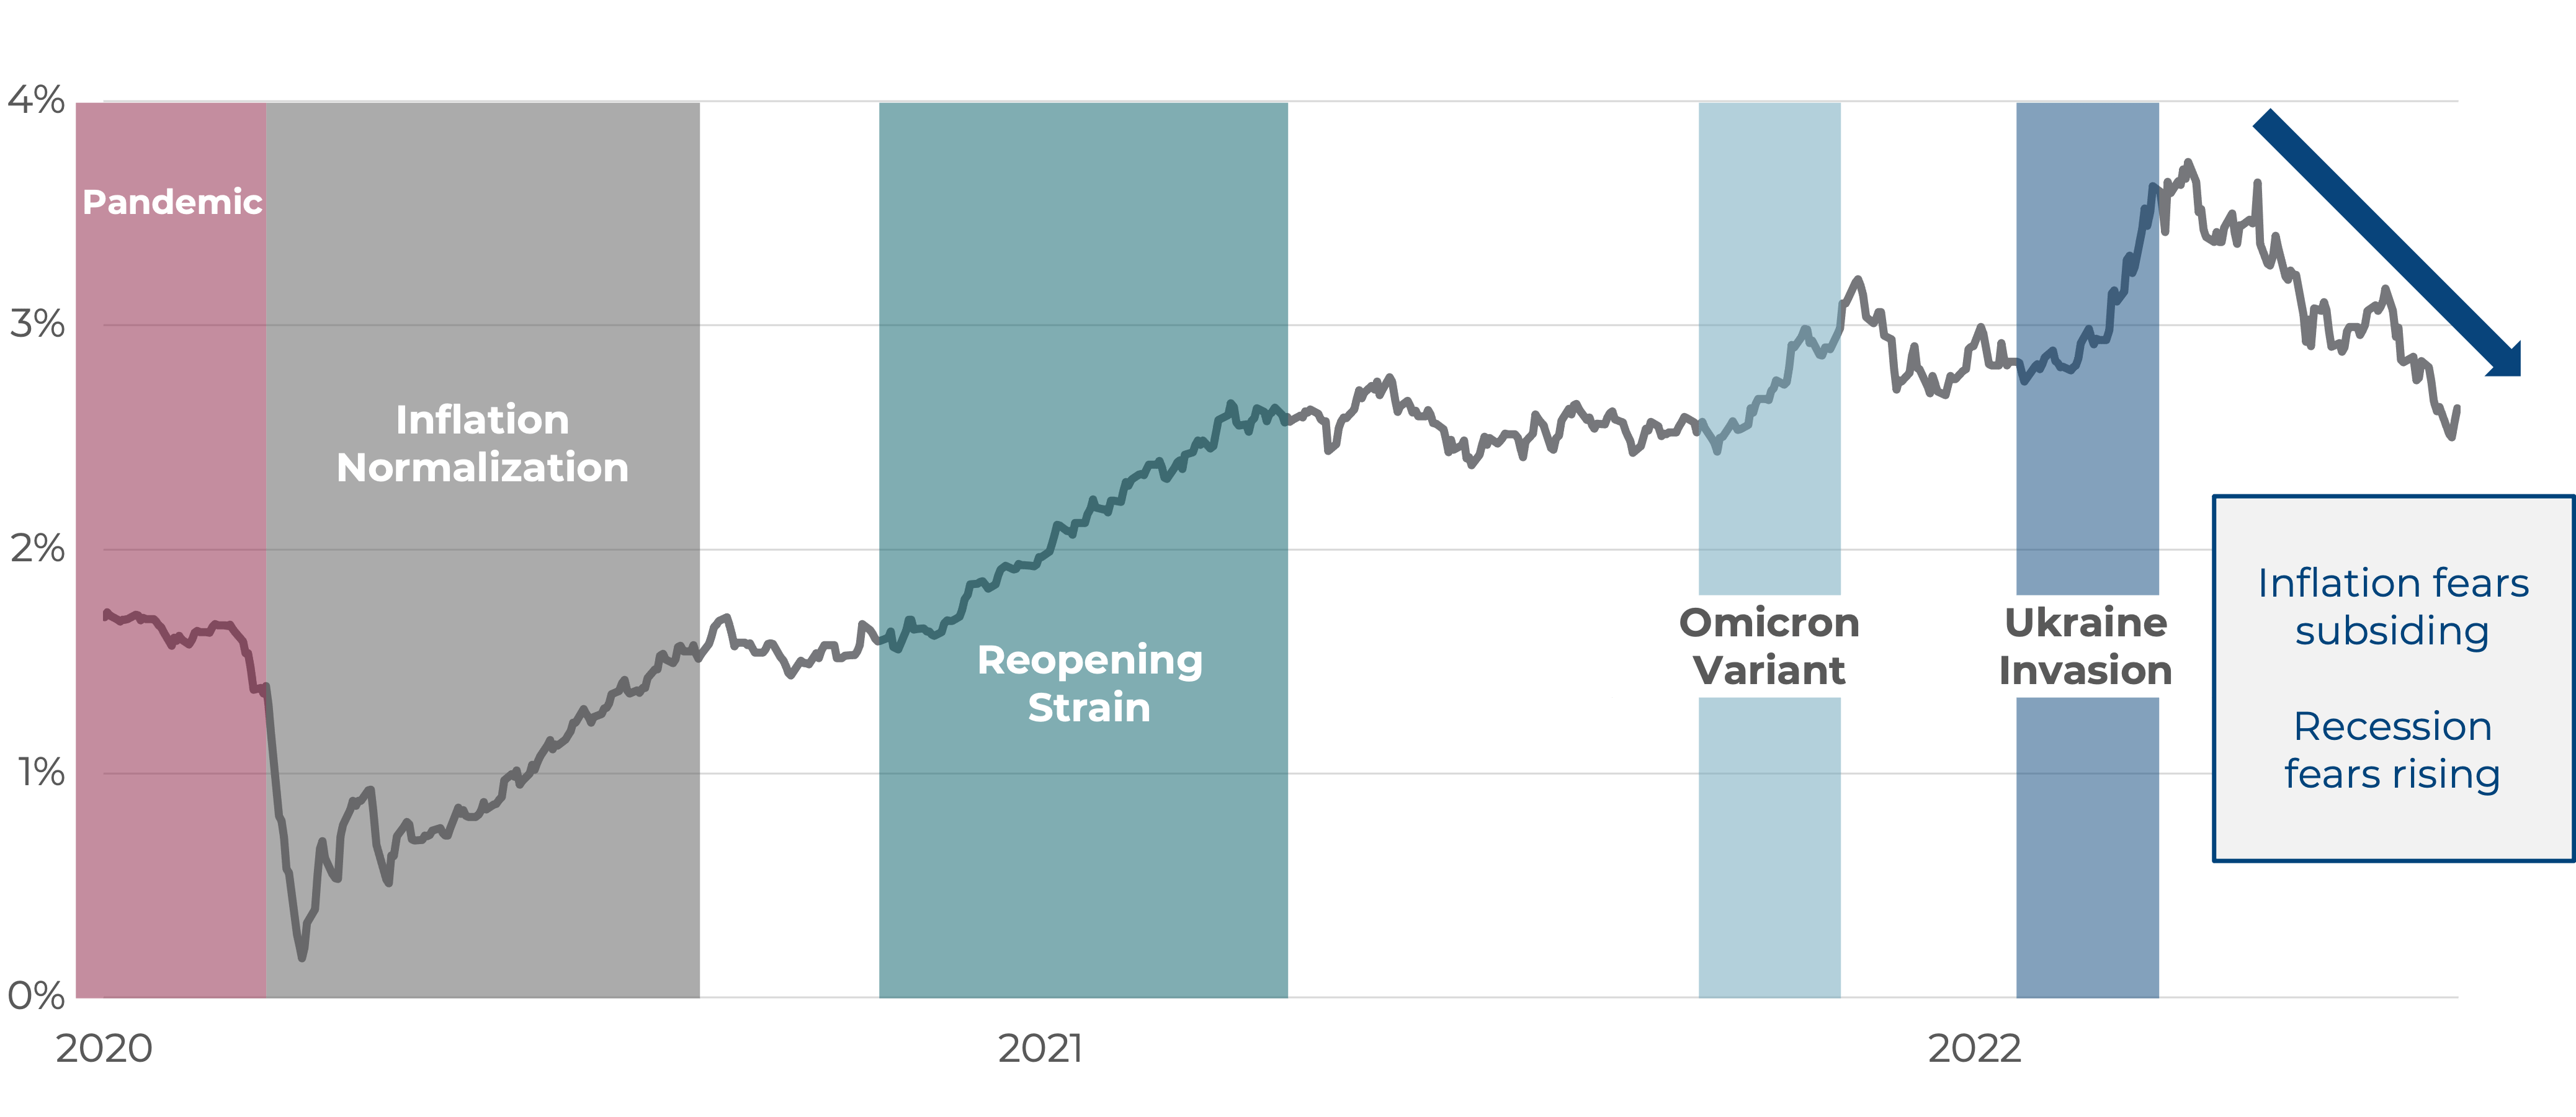
Sources: Bloomberg, CAPTRUST Research. Data through July 8, 2022. Inflation expectations are represented by the five-year Treasury inflation-protected securities breakeven inflation rate.
The inflation narrative has broadened from one of COVID-19-related goods shortages to price increases taking direct aim at household budgets. Rising costs of necessities, such as food and gasoline, have consumed a greater share of consumers’ disposable incomes and eaten into stimulus-related savings. With the June Consumer Price Index (CPI) reaching a four-decade high of 9.1 percent, inflation remains top of mind. However, just as significant as the inflation reading is the Federal Reserve’s reaction.
A Little Background
Since the beginning of the year, anticipation of a higher federal funds rate had been trickling through the financial system, impacting business and consumer borrowing costs, before the Fed implemented its recent rate hikes.
Consumers felt an immediate impact, as the cost of auto loans and mortgages soared. Mortgage rates reached a 13-year high in June, driving a 55 percent increase in the average monthly mortgage payment since the beginning of the year. This, in addition to home price appreciation, has impacted housing affordability and pushed buyers out of the market.
Rising interest rates have also been the catalyst for lower equity and fixed income returns. Bond prices move inversely to interest rates or yields; as interest rates rise, bond prices fall.
The 2-year U.S. Treasury’s yield jumped from 0.7 percent in January to 2.9 percent at the end of the quarter. The benchmark 10-year U.S. Treasury saw a similar increase, reaching 3.47 percent in mid-June, its highest level since 2011, before ending the quarter at 2.98 percent, nearly double the rate from the beginning of the year.
The spread between the 2-year and 10-Year Treasury yield is a closely monitored signal. Historically, an inverted yield curve, where short-term rates exceed long-term rates, has reliably signaled a looming economic slowdown. Financial markets saw the U.S. Treasury yield curve invert in early April and twice to date in July.
Overshooting the Soft Landing
Meanwhile, the Fed increased the pace and magnitude of its inflation-fighting response with a 0.25 percent increase to the federal funds rate in March followed by a 0.50 percent increase in May and a 0.75 percent increase in June. Still, inflation continues to climb higher through the beginning of the third quarter.
Even worse, we estimate supply constraints have directly contributed to approximately 65 percent of the CPI’s recent increases. To complicate matters, the Fed’s monetary policy tools have limited efficacy against such constraints, which leaves it in a precarious position. With the CPI reaching 9.1 percent in June, the Fed may take a prolonged and aggressive stance to reduce demand to these constrained supply levels to rein in inflation, even at the cost of a policy-induced recession.
This dynamic reduces the likelihood of a Fed-orchestrated economic soft landing. In this ideal scenario, the Fed must reduce market excesses and bring inflation down to its long-term 2 percent target level without pushing the economy into recession.
Signs of a Fed-Induced Recession
While inflation grabs the headlines, investor concerns have been subtly shifting away from higher prices and toward the increasing possibility of a recession. The following indicators point to the beginnings of an economic slowdown.
- The five-year forward inflation expectation rate (as measured by the Treasury inflation-protected securities breakeven yield) has been on a steady decline since mid-June (again, as shown in Figure Two). This recent decline marks the largest drop in inflation expectations since the start of the pandemic in 2020.
- In May, housing affordability reached its lowest level since 2006. Mortgage rates climbing in tandem with the federal funds rate is creating the Fed’s desired effect. The overheated housing market is showing signs of cooling as sellers are beginning to negotiate and buyers—particularly entry-level buyers—are exiting the market.
- Consumer spending is on a downward trajectory, gaining just 0.2 percent in May. As prices rise, consumers are financing their purchases through excess savings accumulated during the peak of government stimulus. As these savings wane, consumers will likely delay large purchases, reduce travel, and spend fewer days in the office to reduce gas consumption.
While rising grocery and gas prices have directly affected consumer spending, a secondary effect is also likely to influence spending. This effect, known as the negative wealth effect, focuses on consumer balance sheets. Double-digit declines in stock and bond prices, 12-year lows in the personal savings rate, and potential housing price pressure all contribute to a level of wealth destruction that could be equally impactful to economic activity. Given these economic headwinds, corporate earnings are now increasingly in the spotlight for investors.
Corporate Valuations and Profitability
To date, 2022’s stock market declines have primarily been a correction in corporate valuations. The forward price-to-earnings (P/E) multiple of the S&P 500 Index began the year above 25x. Multiples have since fallen to 16x, a level in line with long-term averages. This drop has been driven by two factors shown in Figure Three. The first is the 20 percent decline in stock prices; the second is industry analysts’ expectations for continued earnings growth.
Figure Three: Percent Change in S&P 500, Earnings, and Valuations (Year to Date 2022)
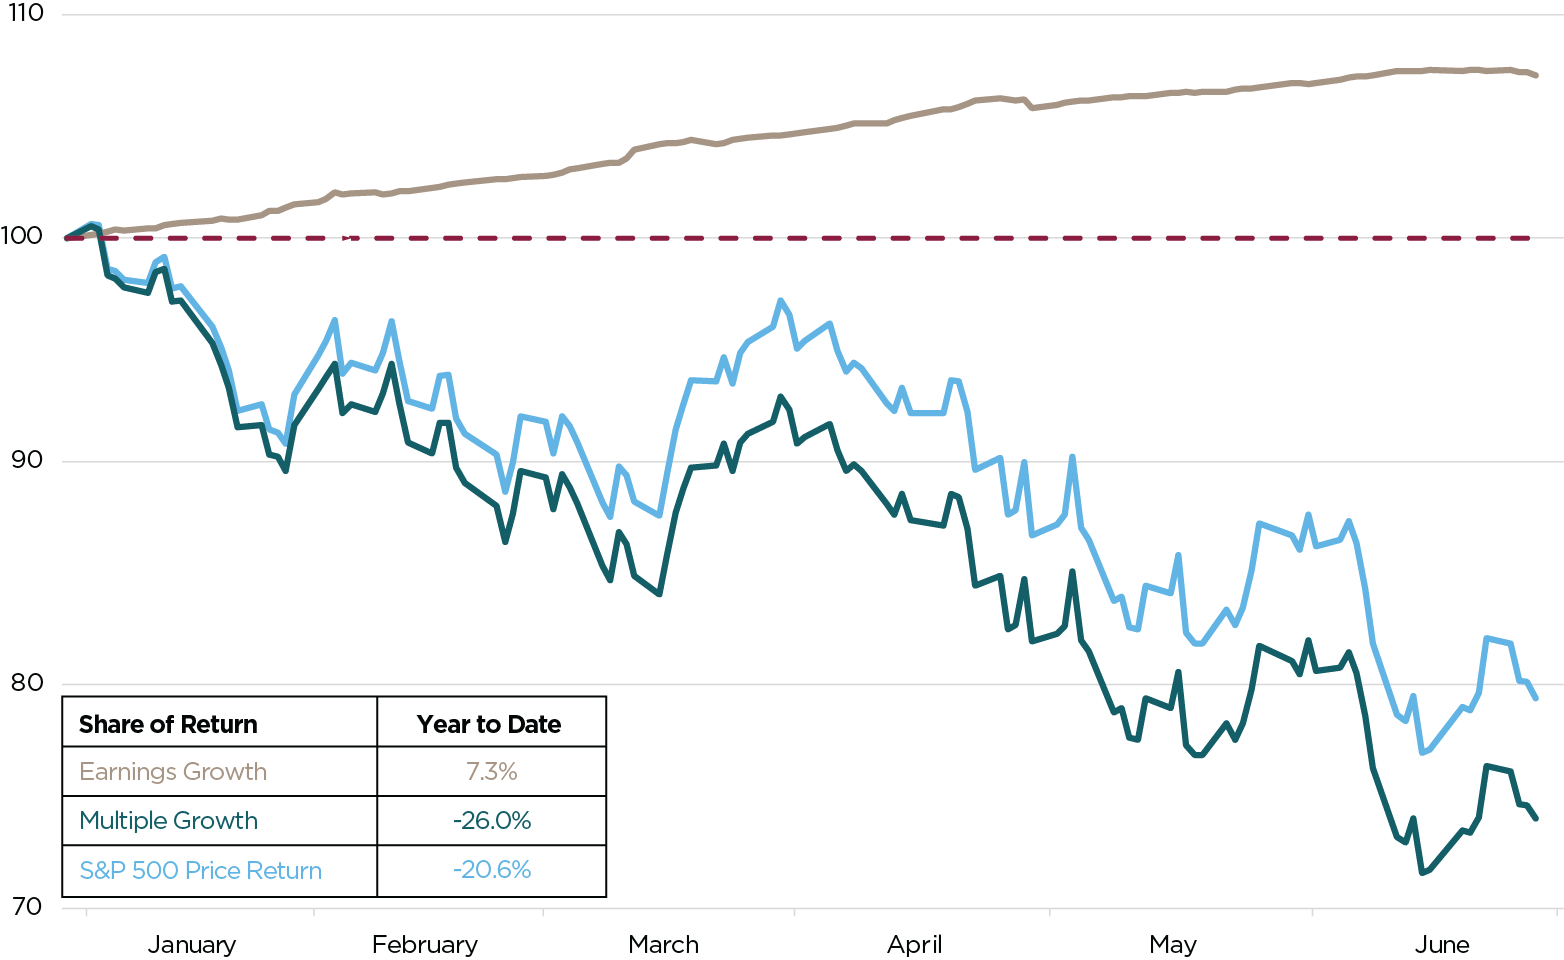
Sources: J.P. Morgan Asset Management, CAPTRUST Research.
Is it possible that companies have navigated their supply-chain challenges and effectively passed price increases on to consumers? Have they been able to maintain profitability growth, albeit at lower levels? These are important questions as we look ahead to corporate earnings reports and guidance that will inform analysts’ revised estimates.
While the veracity of these estimates will be fleshed out in the coming weeks as second quarter earnings results are reported, one thing remains certain: Valuation dispersion is increasing. As of May 2022, more than 500 companies in the Russell 3000 Index traded with forward price-to-earnings ratios below 10x.
Although 500 is not a magic threshold, a CAPTRUST study going back 20 years shows that only seven quarter-end periods met this criterion. In all but one occurrence, equity investors experienced double-digit annualized gains over the two years that followed.
Bull Market for Pessimism
Rising expenses and falling asset prices have both consumers and investors in a foul mood. However, history shows us that troughs in sentiment are often followed by market rallies. Reviewing the University of Michigan’s Consumer Sentiment Index, which surveys consumer confidence in current and future economic conditions, shows an average 12-month return of 20 percent in the four instances in which this gauge fell below 60. The survey currently reads an all-time low of 50.
Figure Four: Consumer Sentiment
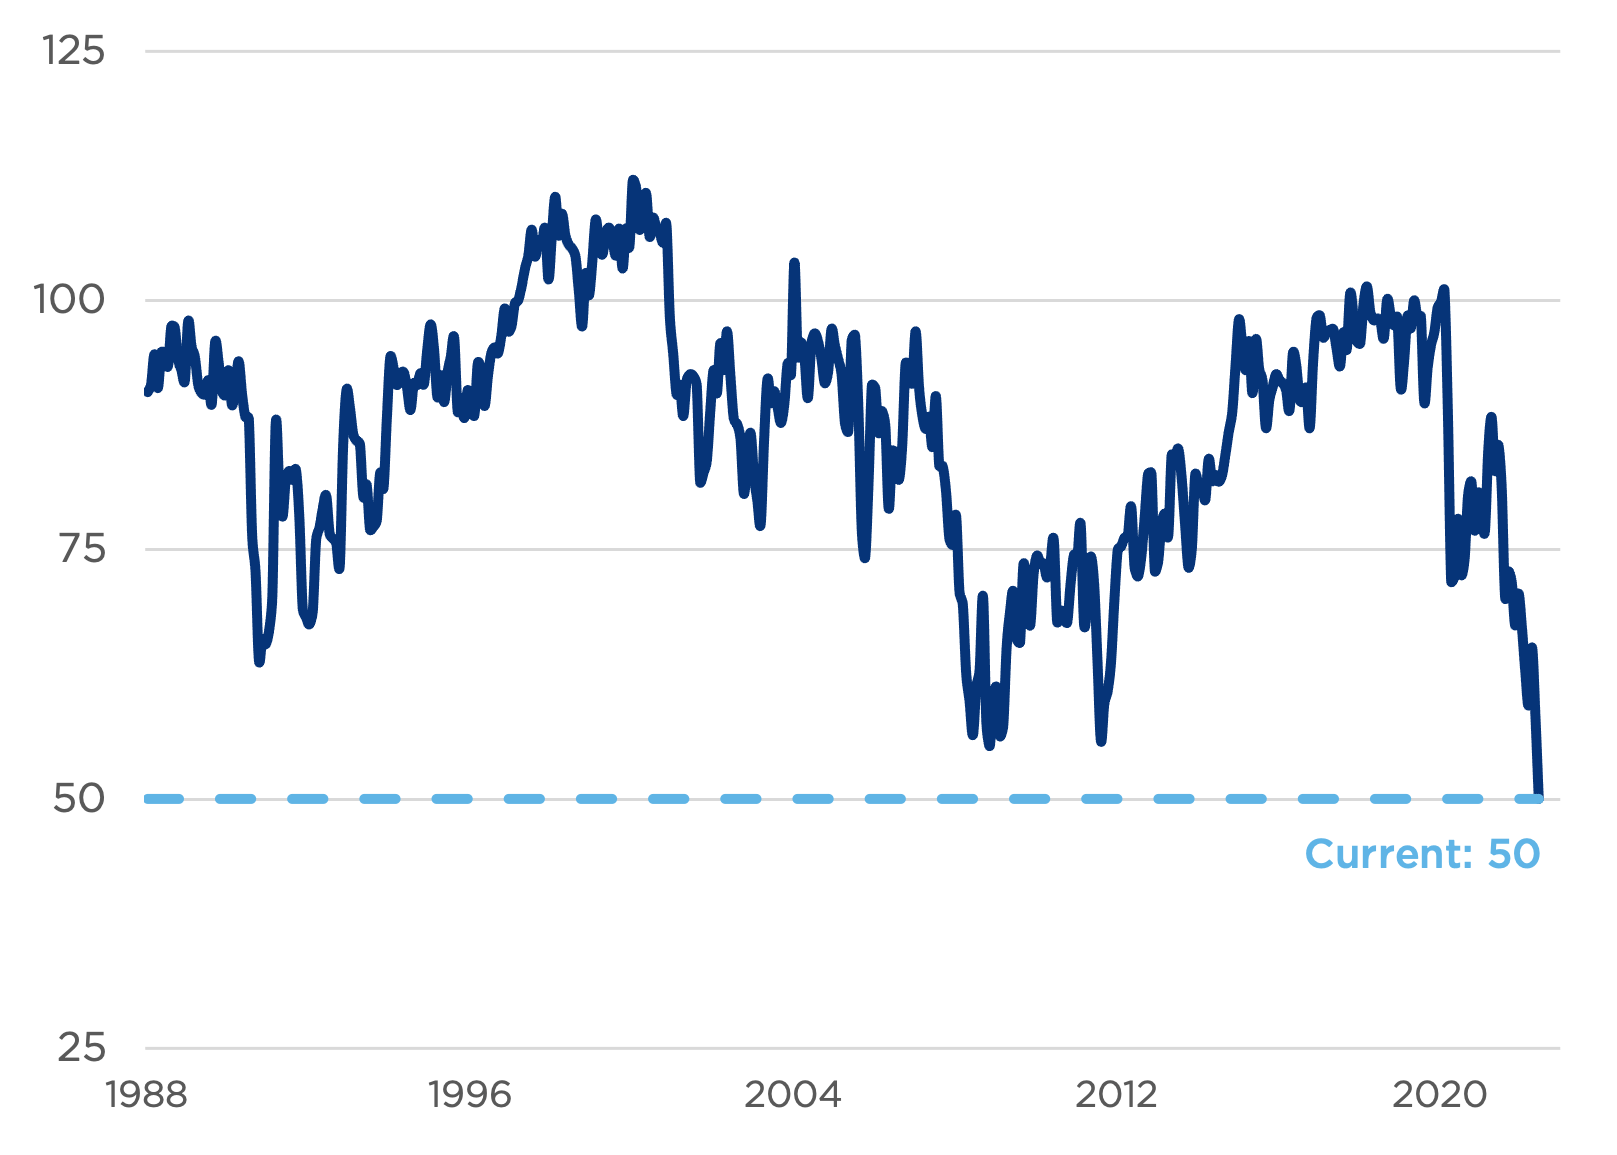
Sources: University of Michigan: Consumer Sentiment Index
Investor sentiment data tells a similar story. A survey conducted by the American Association of Individual Investors on the percentage of investors with a bearish outlook reached 59.3 percent in June 2022. This level has not been seen since the depths of the financial crisis in early 2009, which coincided with that turbulent period’s market bottom.
What Is the Market Telling Us?
So often, the term priced in is used in relation to the financial markets. What does that mean exactly, and what is the relevance now? Investing requires making judgments about the future, and those judgements attempt to capture the knowable range of things that can happen. Influencing factors could be event-driven, data-driven, corporate, or economic. And when unexpected or unforeseeable events—like Russia’s invasion of Ukraine of February 24—occur, the market must recalibrate, pricing in the new information.
Since that week, the S&P 500 Index has fallen 11 percent (through July 15) and the Bloomberg U.S. Aggregate Bond Index has fallen 6 percent. Circling back to the financial and economic indicators presented earlier: Corporate valuations have moderated, and investor and consumer sentiment are hovering near all-time lows. Piecing all this information together, the financial markets are clearly demonstrating a greater awareness of the current economic challenges.
The case for hope? Today’s low expectations increase the potential for future, positive outcomes. A surprise to the upside—even if it’s a less-negative data point—could be the catalyst for higher prices and better returns in months and years ahead.
While this may sound counterintuitive, it is important to remember that markets don’t move based on good or bad news; they move based on better or worse news. And, with investors, consumers, and policy makers all understanding and discounting the riskier investment landscape, the possibility for upside surprises and better outcomes has increased.
Figure Five: First Half Returns for U.S. Stocks and Core Bonds (since 1976)
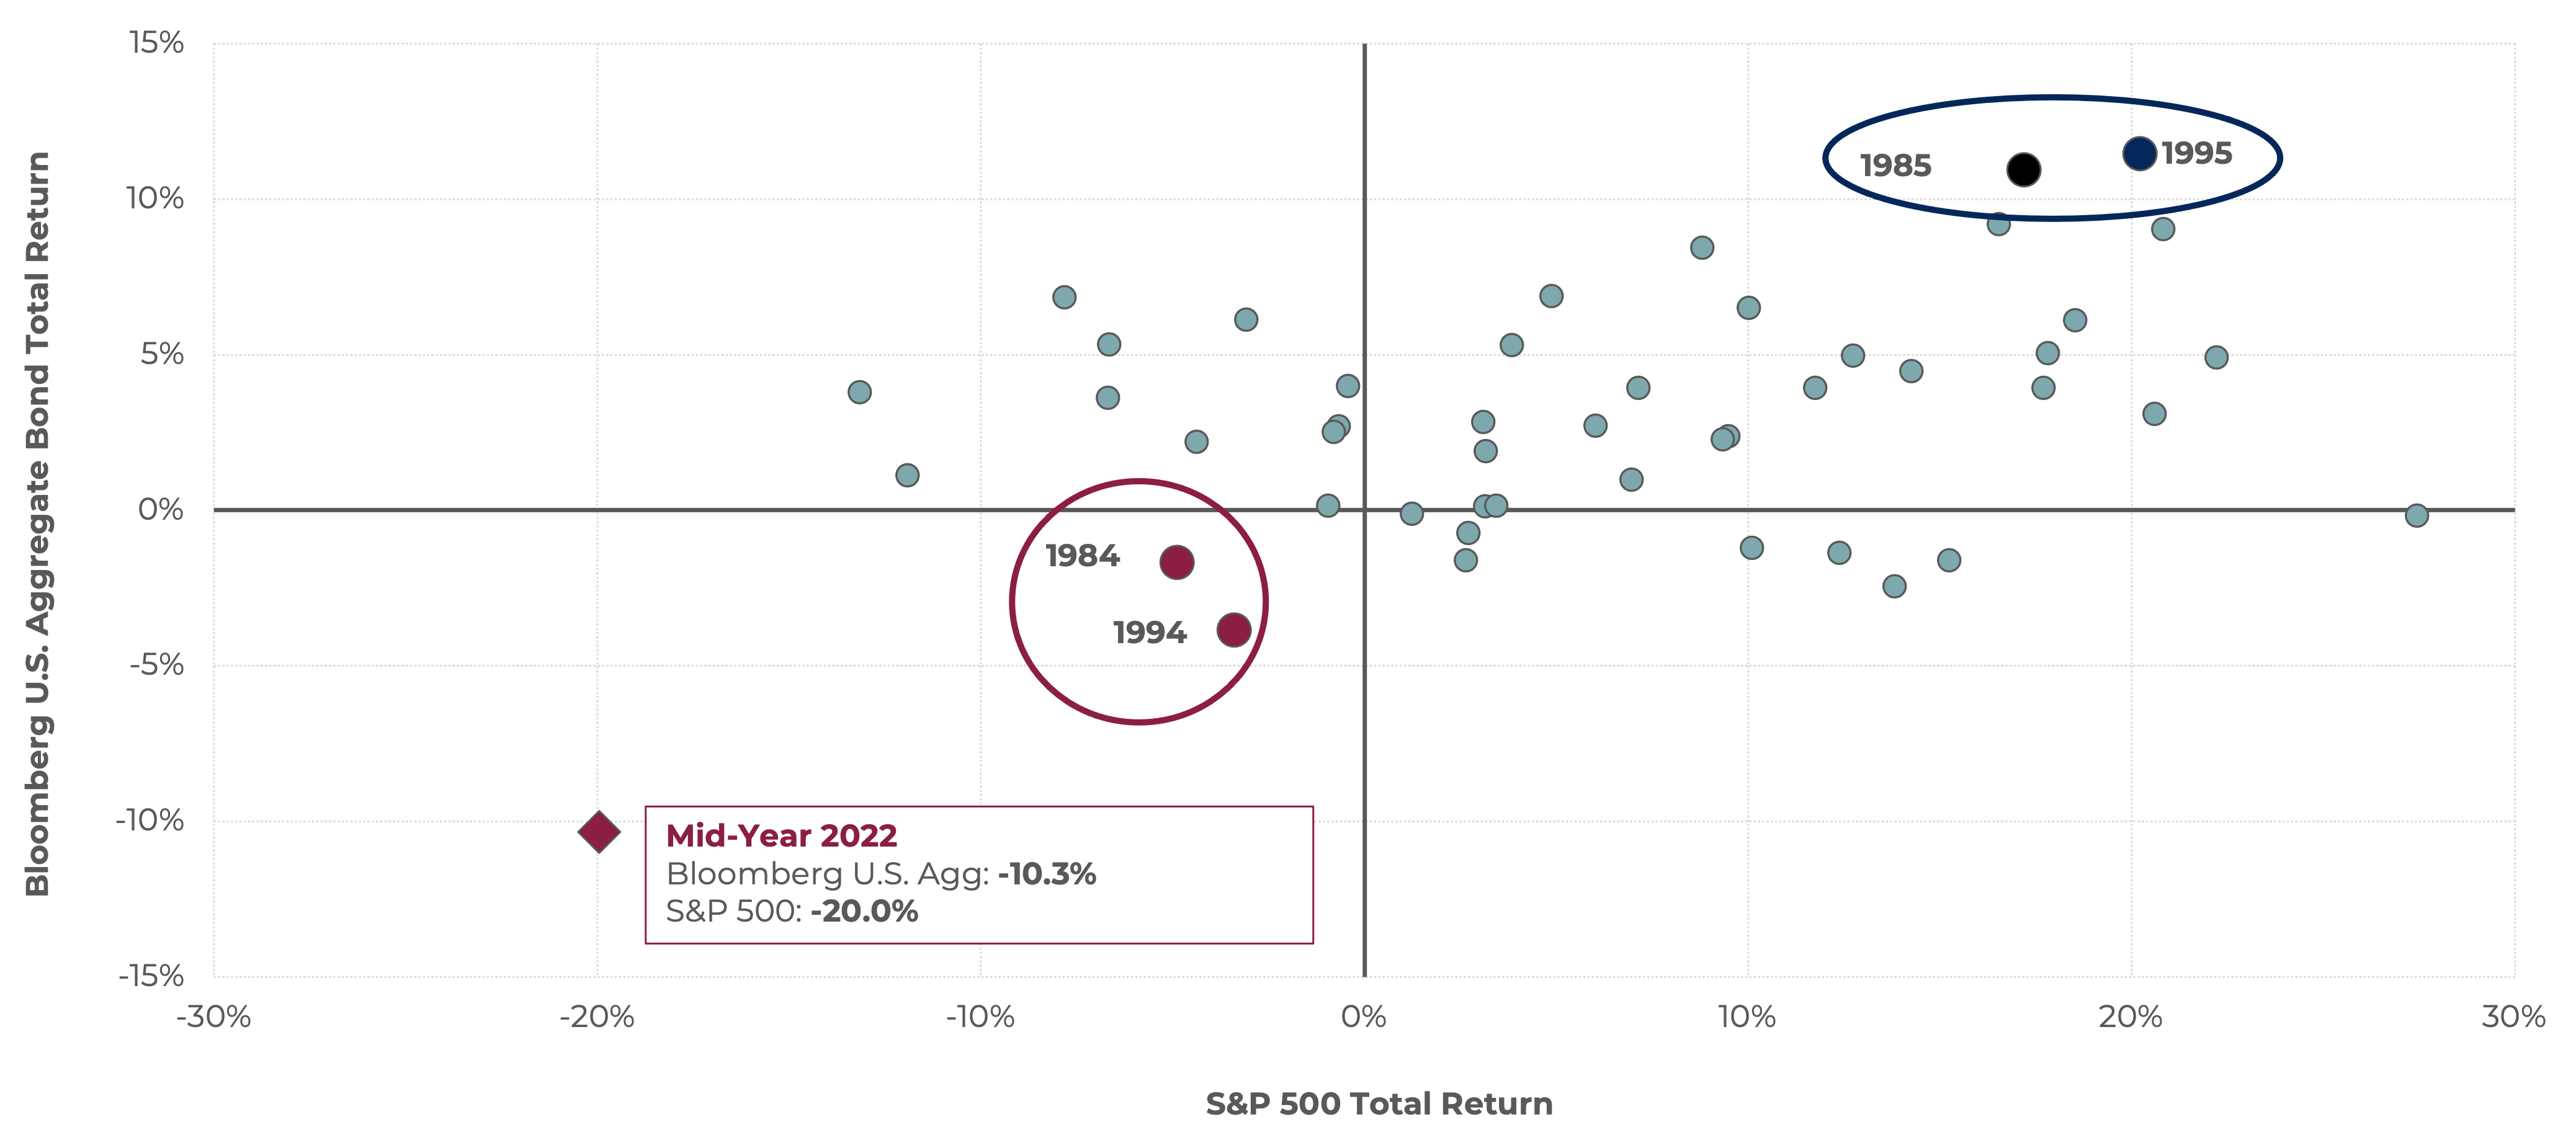
Historical data supports this idea. The first half of 2022 marks a rare instance when both stocks and bonds fell in concert. Since 1976, we have seen only two other times—1984 and 1994—when both stocks and bonds reached negative territory at the halfway point. But, as demonstrated in Figure Five, these challenging environments, where expectations were reset lower, set the stage for two of the best midyear returns in the following years—1985 and 1995.
Will history repeat itself? Only time will tell.
