Third Quarter 2025 Investment Strategy | Return on Expectations
Key Takeaways
- Markets rallied in the third quarter as trade tensions abated, technology infrastructure investment abounded, and the Federal Reserve delivered its first cut of 2025.
- Economic dependence on the AI theme continues to expand. A small group of tech companies have delivered about half of the S&P 500 Index’s year-to-date return while also accounting for almost a third of capital expenditures.
- U.S. corporations continue to outperform expectations, with higher revenue and profits that support a virtuous cycle as robust earnings fund further investments.
- Progress rarely follows a straight line. Investors can celebrate recent gains and optimism for the future while remaining grounded by their financial plan and investment discipline.
Global equity indices extended gains in the third quarter, with several major benchmarks setting fresh highs. A combination of macroeconomic strength, solid corporate profits, and heavy investment in technology has powered the climb. Even with lingering inflation, fast-changing policy, and unproven AI payoffs, financial markets continue to look ahead.
Third Quarter Recap: Markets Remain Focused on the Positives
A wide range of asset classes, led by global equity markets, enjoyed a strong third quarter.
Within the U.S., the S&P 500 Index delivered an 8.1 percent return as only one sector (consumer staples) posted a loss. Yet gains continue to be narrowly led, as just three growth-oriented sectors, technology, communication services, and consumer discretionary, delivered the lion’s share of returns.
Small-cap stocks performed even better, as rate-cut expectations suggested relief was on the way for more interest-rate-sensitive companies. Risk appetites rose as less-profitable, lower-quality stocks outperformed their more profitable peers.
Outside the U.S., equity returns were uneven. Emerging market stocks returned close to 11 percent over the period, with semiconductor leaders in China, Korea, and Taiwan benefiting from global demand. Progress on U.S. trade talks provided further support. Developed market international stocks also advanced, led by European banks, a growing global services sector, and ongoing market-friendly reforms in Japan.
U.S. bonds benefitted from falling yields, particularly within shorter-dated maturities, on expectations of Fed rate cuts. Investment grade corporate bonds continue to reflect credit spreads at multidecade lows, signaling continued investor confidence in company fundamentals.
Commodities rebounded, led by an acceleration of gold’s spectacular rally, as investors sought hedges for a variety of risks: economic, policy, and geopolitical.
Figure 1: Q3 2025 Market Rewind
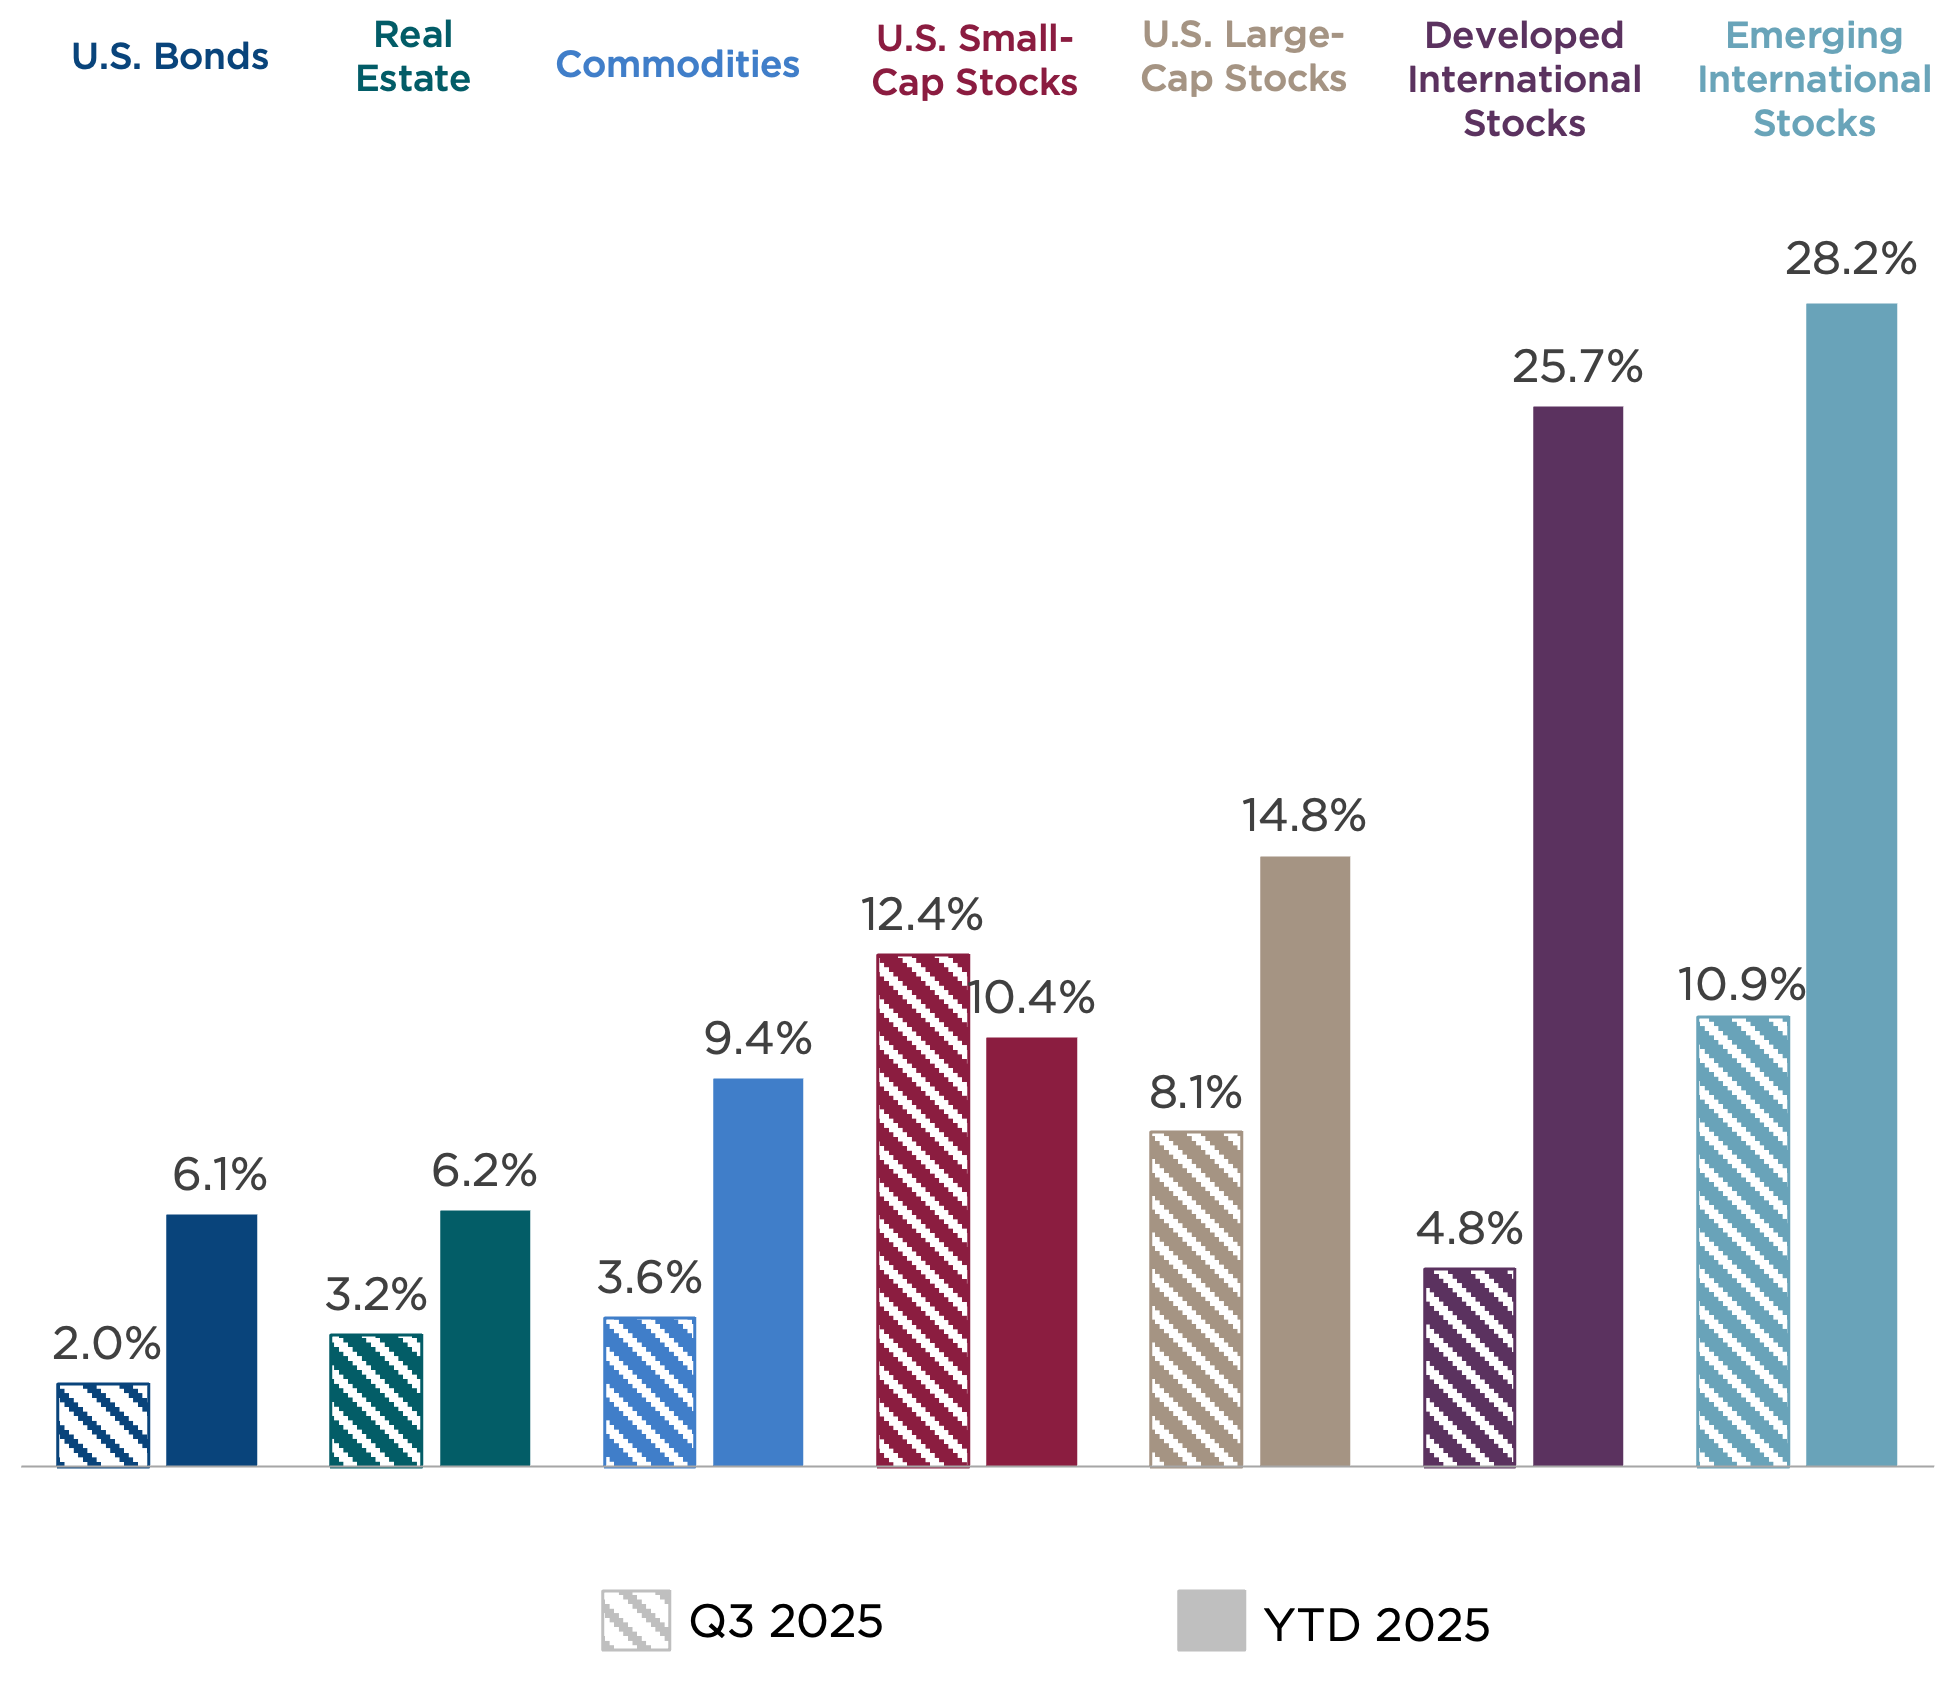
Asset class returns are represented by the following indexes: Bloomberg U.S. Aggregate Bond Index (U.S. bonds), Dow Jones U.S. Real Estate Index (real estate), Bloomberg Commodity Index (commodities), Russell 2000® (U.S. small-cap stocks), S&P 500 Index (U.S. large-cap stocks), MSCI EAFE Index (international developed market stocks), and MSCI Emerging Market Index (emerging market stocks).
Echoes of Innovation
Entirely new economic eras can be triggered by a single innovation. The steam engine, the Wright brothers’ Flyer, Sputnik 1, and the launch of the first web browser each marked inflection points with massive economic implications.
The launch of ChatGPT 3.5 in November 2022 can be viewed as such an event. In the three years since, over $1 trillion has been invested in advanced chips and stadium-sized data centers to provide the computing horsepower required for cutting-edge AI models.
The parallels to the dot-com bubble of the late 1990s are striking. As telecom companies raced to wire the world with high-speed internet, Cisco Systems, a leading maker of network routers and switches, saw its share price rocket 3,800 percent in about five years. At its peak, investors were willing to pay nearly 95 times Cisco’s future earnings per share, driven by the belief that the sky was the limit for internet innovation.
Today’s AI frenzy has accelerated even faster than the dot-com bubble. The internet reached 100 million users in seven years, while ChatGPT achieved this threshold in just two months. Following that trajectory, the market capitalization of NVIDIA, a key supplier of advanced AI chips, has grown from $400 billion to $4.5 trillion since the launch of ChatGPT. This is equivalent to nearly 15 percent of the entire U.S. economy, as measured by Gross Domestic Product (GDP).
We know how the dot-com era ended: Economic realities caught up with unbridled optimism. Experimental business models failed to deliver profits, and the speculative buildout of internet infrastructure led to investment in over 300,000 miles of fiber optic cable, much of which remained unused for a decade or more before real-world demand caught up.
However, the current environment also has some important differences from the dot-com era, including:
- Earnings underpinning. While NVIDIA’s stock price has climbed, insatiable demand and dominant pricing power have also accelerated profits. At quarter-end, NVIDIA was trading near 41 times forward earnings—certainly rich, but well below bubble levels.
- Cash flows, not speculation. The majority of funding for AI infrastructure is coming from cash flow powerhouses. Amazon, Alphabet (Google), Microsoft, and Meta are among the most profitable companies in the world.
- Early payoffs. Unlike many dot-com darlings with farfetched business models, early investments in AI infrastructure are already translating to revenue for major tech firms. AI users are also reporting productivity gains, with one Fortune 500 firm reporting a 14 percent improvement in efficiency for its customer support agents provided with an AI assistant.[1]
Figure 2: Cisco Systems and NVIDIA Market Cap Expansion (% of U.S. GDP)
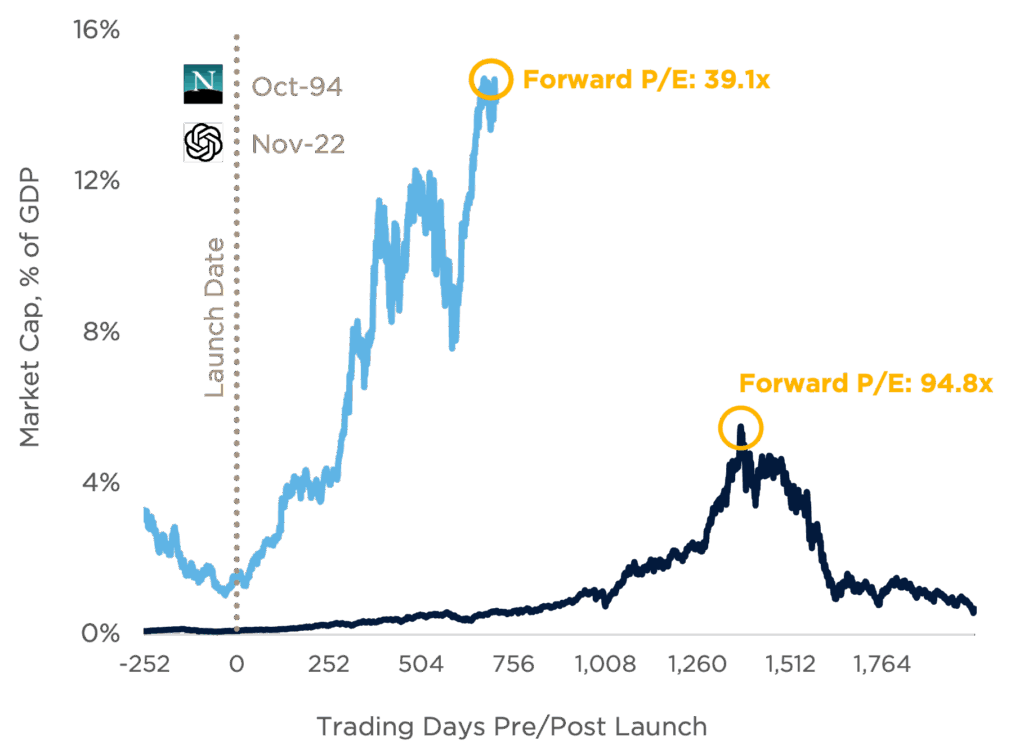
Sources: Bloomberg, World Bank, Wall Street Journal, CAPTRUST research. Data as of September 19, 2025.
This year has also delivered evidence of what can happen when doubts creep into the narrative. In late January, China‑based DeepSeek rattled markets by delivering competitive AI performance at a fraction of the cost of existing flagship models. This announcement triggered a massive tech selloff. NVIDIA alone shed nearly $600 billion in market cap in a single day—the largest single-day market cap loss in stock market history—as investors questioned whether its advanced chips justified the premium valuation of its stock.
Investor hopes for AI’s impact are elevated. Although the dot-com era is an imperfect analog, it does remind us that breakthroughs don’t always pay off on schedule. Even if the technology ultimately overdelivers, the economic benefits may arrive on a timeline at odds with current market expectations.
Higher Margins Drive Investment and Growth
This year, U.S. corporations have performed better than expected, growing revenue and earnings despite tariff-related cost pressures. Nearly 80 percent of S&P 500 Index companies outpaced earnings targets in the most recent reporting period. Higher profitability has been driven by selective price increases and product mix adjustments, tighter operating discipline, supply chain optimization, and productivity gains. As shown in Figure 3, profit margin expansion has amplified earnings growth, providing continuing support for equity prices even at above-average valuations.[2]
Figure 3: S&P 500 Operating Margins Continue to Trend Higher
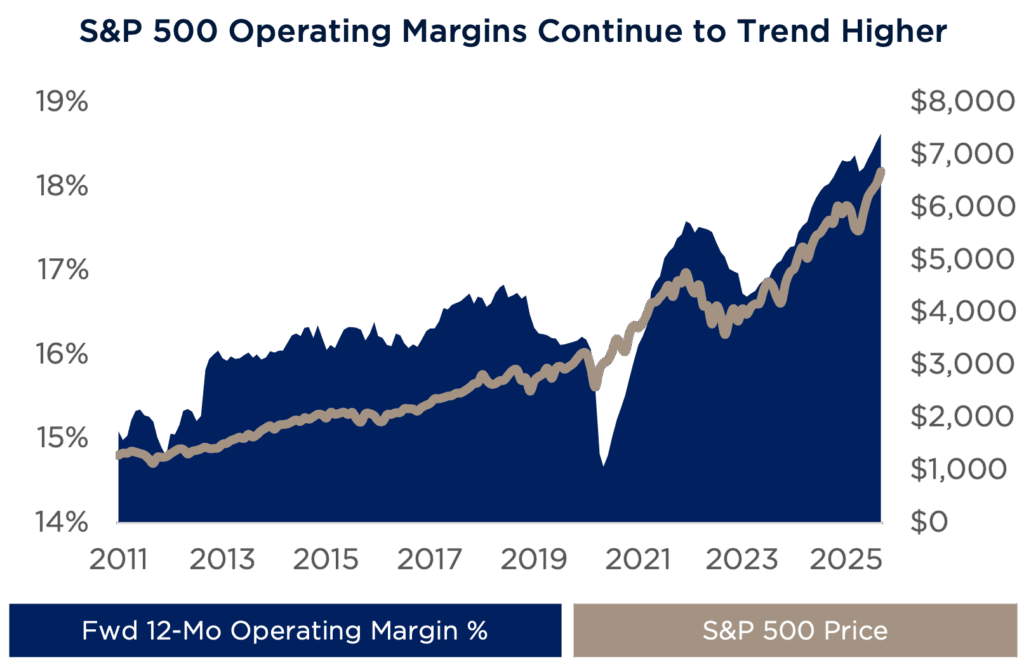
Sources: FactSet, CAPTRUST research. Data as of September 30, 2025.
Strong cash generation has translated into aggressive investment plans. In addition to the AI infrastructure build-out, utilities firms are investing heavily to harden and expand the power grid, manufacturers are committing to flagship projects, and tax policy tailwinds are pulling orders forward. When strong fundamentals provide companies with the means and confidence to invest in the future, the economy and markets can often power through headwinds.
Rate Cut Hopes, Real Risks
In September, the Federal Reserve began easing monetary policy with a quarter-point risk management reduction in its federal funds target rate. What made this move so notable is the relative strength of the economic backdrop: Inflation is still above the Fed’s 2 percent target, the unemployment rate remains near multidecade lows, equity indices are hovering near record highs, and financial conditions are loose.
Federal Reserve Chair Jerome Powell framed the move as a policy recalibration rather than a pivot to easy monetary policy. He described current labor market conditions as “unusual,” noting a slowdown in both the supply and demand for workers, as well as payroll gains slipping below the breakeven pace required to hold unemployment steady (Figure 4). Nevertheless, financial markets are currently pricing in two more rate cuts this year, and an additional three cuts in 2026. Expectations for aggressive easing could create downside risks for markets if they fail to materialize.
Figure 4: Labor Market: Cooling Demand, Stalled Supply
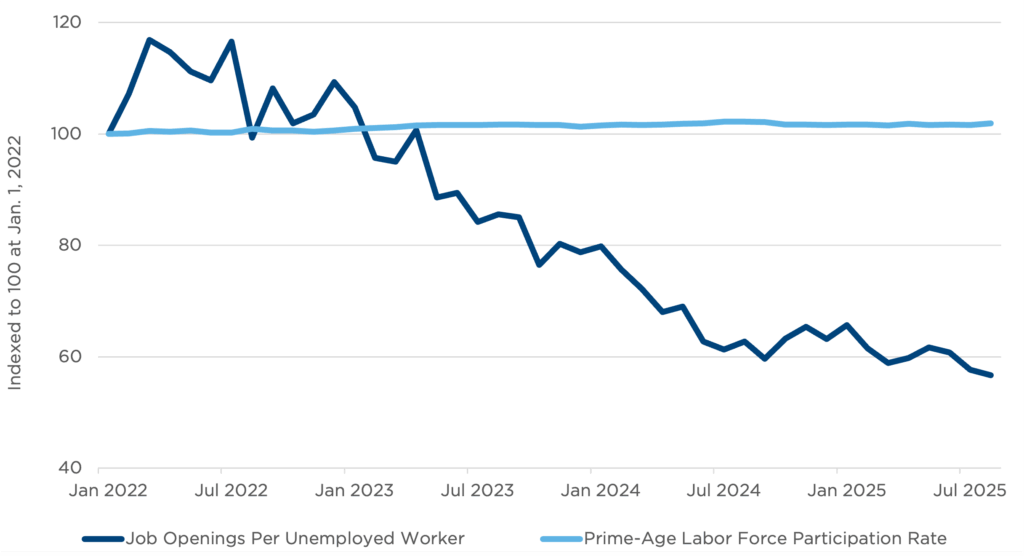
Sources: U.S. Bureau of Labor Statistics, Federal Reserve Bank of St. Louis, CAPTRUST research.
The current environment represents a tightrope walk for the Federal Reserve amid growing political pressure for lower rates. Inflation has stalled at around 2.7 percent, with tariff-sensitive goods prices rising as services prices fall. Cutting rates too quickly risks exacerbating inflation, while a delay could serve to lock in labor market fragility. As Powell noted, “Two-sided risks mean there’s no risk-free path.”
Consumers: Feeling Low but Spending Freely
The state of the U.S. consumer is both resilient and restless. Although household budgets remain challenged by high interest rates, stubborn inflation, and a cooling labor market, spending remains firm. Consumer spending rose 2.7 percent in August, providing ongoing support for strong U.S. economic growth.
Although spending keeps chugging along, sentiment rests near crisis‑era lows. In addition, the distribution of consumer activity is highly skewed. Top‑decile earners now account for nearly half of all spending, while the bottom 40 percent contribute less than 10 percent of spending. Affluent households may be able to sustain economic momentum in the near term, but broader participation is necessary to provide a stronger foundation for growth.[3]
A future source of consumer spending strength could have an unlikely origin: tax season. As a result of the recently passed One Big Beautiful Bill Act (OBBBA), tax withholding table adjustments should lift paychecks early next year, followed by a tax season that is expected to deliver an incremental $150 billion in refunds. While this household budget boost will create meaningful economic support, the OBBBA is also expected to exacerbate the U.S. budget deficit. Tax breaks for corporations and consumers will contribute an additional $3.4 trillion to the budget shortfall over the next decade.[4]
Priced on Promise
When expectations get stretched, even small disappointments can earn outsized reactions. Companies and investors are placing their faith, and vast sums of money, in the promise of AI to deliver higher productivity, economic efficiency, and new profit engines. Although these gains may take years to unfold, the AI push is delivering current economic benefits in the form of capital investments that support the real economy.
Investor hopes are also pinned to the ability of the U.S. economy to operate within a narrow growth channel that allows the Fed to continue easing monetary policy. This will require a balance between softening labor market conditions and persistent inflation pressures, against a backdrop of political pressures and fast-moving policy changes.
The path of progress is rarely linear, and investors should be prepared to recalibrate their expectations in the event of bouts of volatility and changes in market leadership. Three years of outsized gains, led by mega-cap technology giants, have increased market concentration risk. If investors haven’t been disciplined in rebalancing portfolios to their strategic targets, risk profiles could be out of tolerance.
Investors should celebrate recent gains while also bracing for the possibility that blips in the path of progress could manifest as market pullbacks. When expectations live in the clouds, it pays to remain grounded.
Index Definitions
Indexes are unmanaged, do not incur management fees, costs, and expenses, and cannot be invested in directly.
S&P 500® Index: Measures the performance of 500 leading publicly traded U.S. companies from a broad range of industries. It is a float-adjusted market-capitalization weighted index.
Russell 2000® Index: Measures the performance of the 2,000 smallest companies in the Russell 3000® Index. It is a market-capitalization weighted index.
MSCI EAFE Index: Measures the performance of the large- and mid-cap equity market across 21 developed markets around the world, excluding the U.S. and Canada. It is a free float-adjusted market-capitalization weighted index.
Bloomberg U.S. Intermediate Govt/Credit Bond Index: Measures the performance of the non-securitized component of the US Aggregate Index. It includes investment-grade, US Dollar-Denominated, fixed-rate Treasuries, government-related corporate securities. It is a market-value weighted index.
Bloomberg Commodity Index (BCOM): Measures the performance of 24 exchange-traded futures on physical commodities which are weighted to account for economic significance and market liquidity. BCOM provides broad-based exposure to commodities without a single commodity or commodity sector dominating the index.
MSCI Emerging Markets Index: Measures the performance of large and mid-cap stocks across 24 Emerging Markets countries. It aims to capture the performance of equity markets in emerging economies worldwide and covers approximately 85% of the free float-adjusted market capitalization in each country.
Sources
[1] “Generative AI at Work.” The Quarterly Journal of Economics.
[2] FactSet Insight
[3] Moody’s Analytics, The Wall Street Journal
[4] Strategas, Bipartisan Policy Center