Fourth Quarter 2025 Investment Strategy | Productivity and the Search for AI Payoffs
“Everywhere but in the Productivity Statistics”
In the late 1980s, the personal computer revolution was in full swing. Desktop computers were expected to reinvent workplaces through automation and faster decision-making. Adoption skyrocketed as PC prices fell and computing power soared.
In 1987, the year that Microsoft Windows version 2.0 added desktop icons to screens, about 25 percent of U.S. workers used a computer at work. This is roughly equal to estimated AI use in workplaces today.[1]
Yet that same year, Nobel Prize-winning economist Robert Solow famously quipped, “You can see the computer age everywhere but in the productivity statistics.”
The AI boom of the past three years has fueled one of the greatest wealth-creation engines ever, but the timing and extent of its payoffs are still uncertain. Meanwhile, significant inflationary forces remain in place, just as fiscal stimulus and, potentially, lower interest rates are poised to add fuel to the fire.
This creates a high-stakes footrace. Can the productivity gains promised by AI deliver the economic elixir of disinflationary growth, allowing inflation to settle without stalling the economy?
Market Rewind: Signs of Rotation
The first half of 2025 was defined by the narrow leadership of mega-cap AI stocks. In the fourth quarter, the rest of the market played catch-up.
Global markets ended the year on a decisive upswing, but the leaderboard changed as capital flowed toward broader, more cyclical sectors of the market.
Figure One: Asset Class Returns, Q4 2025 and Full Year 2025
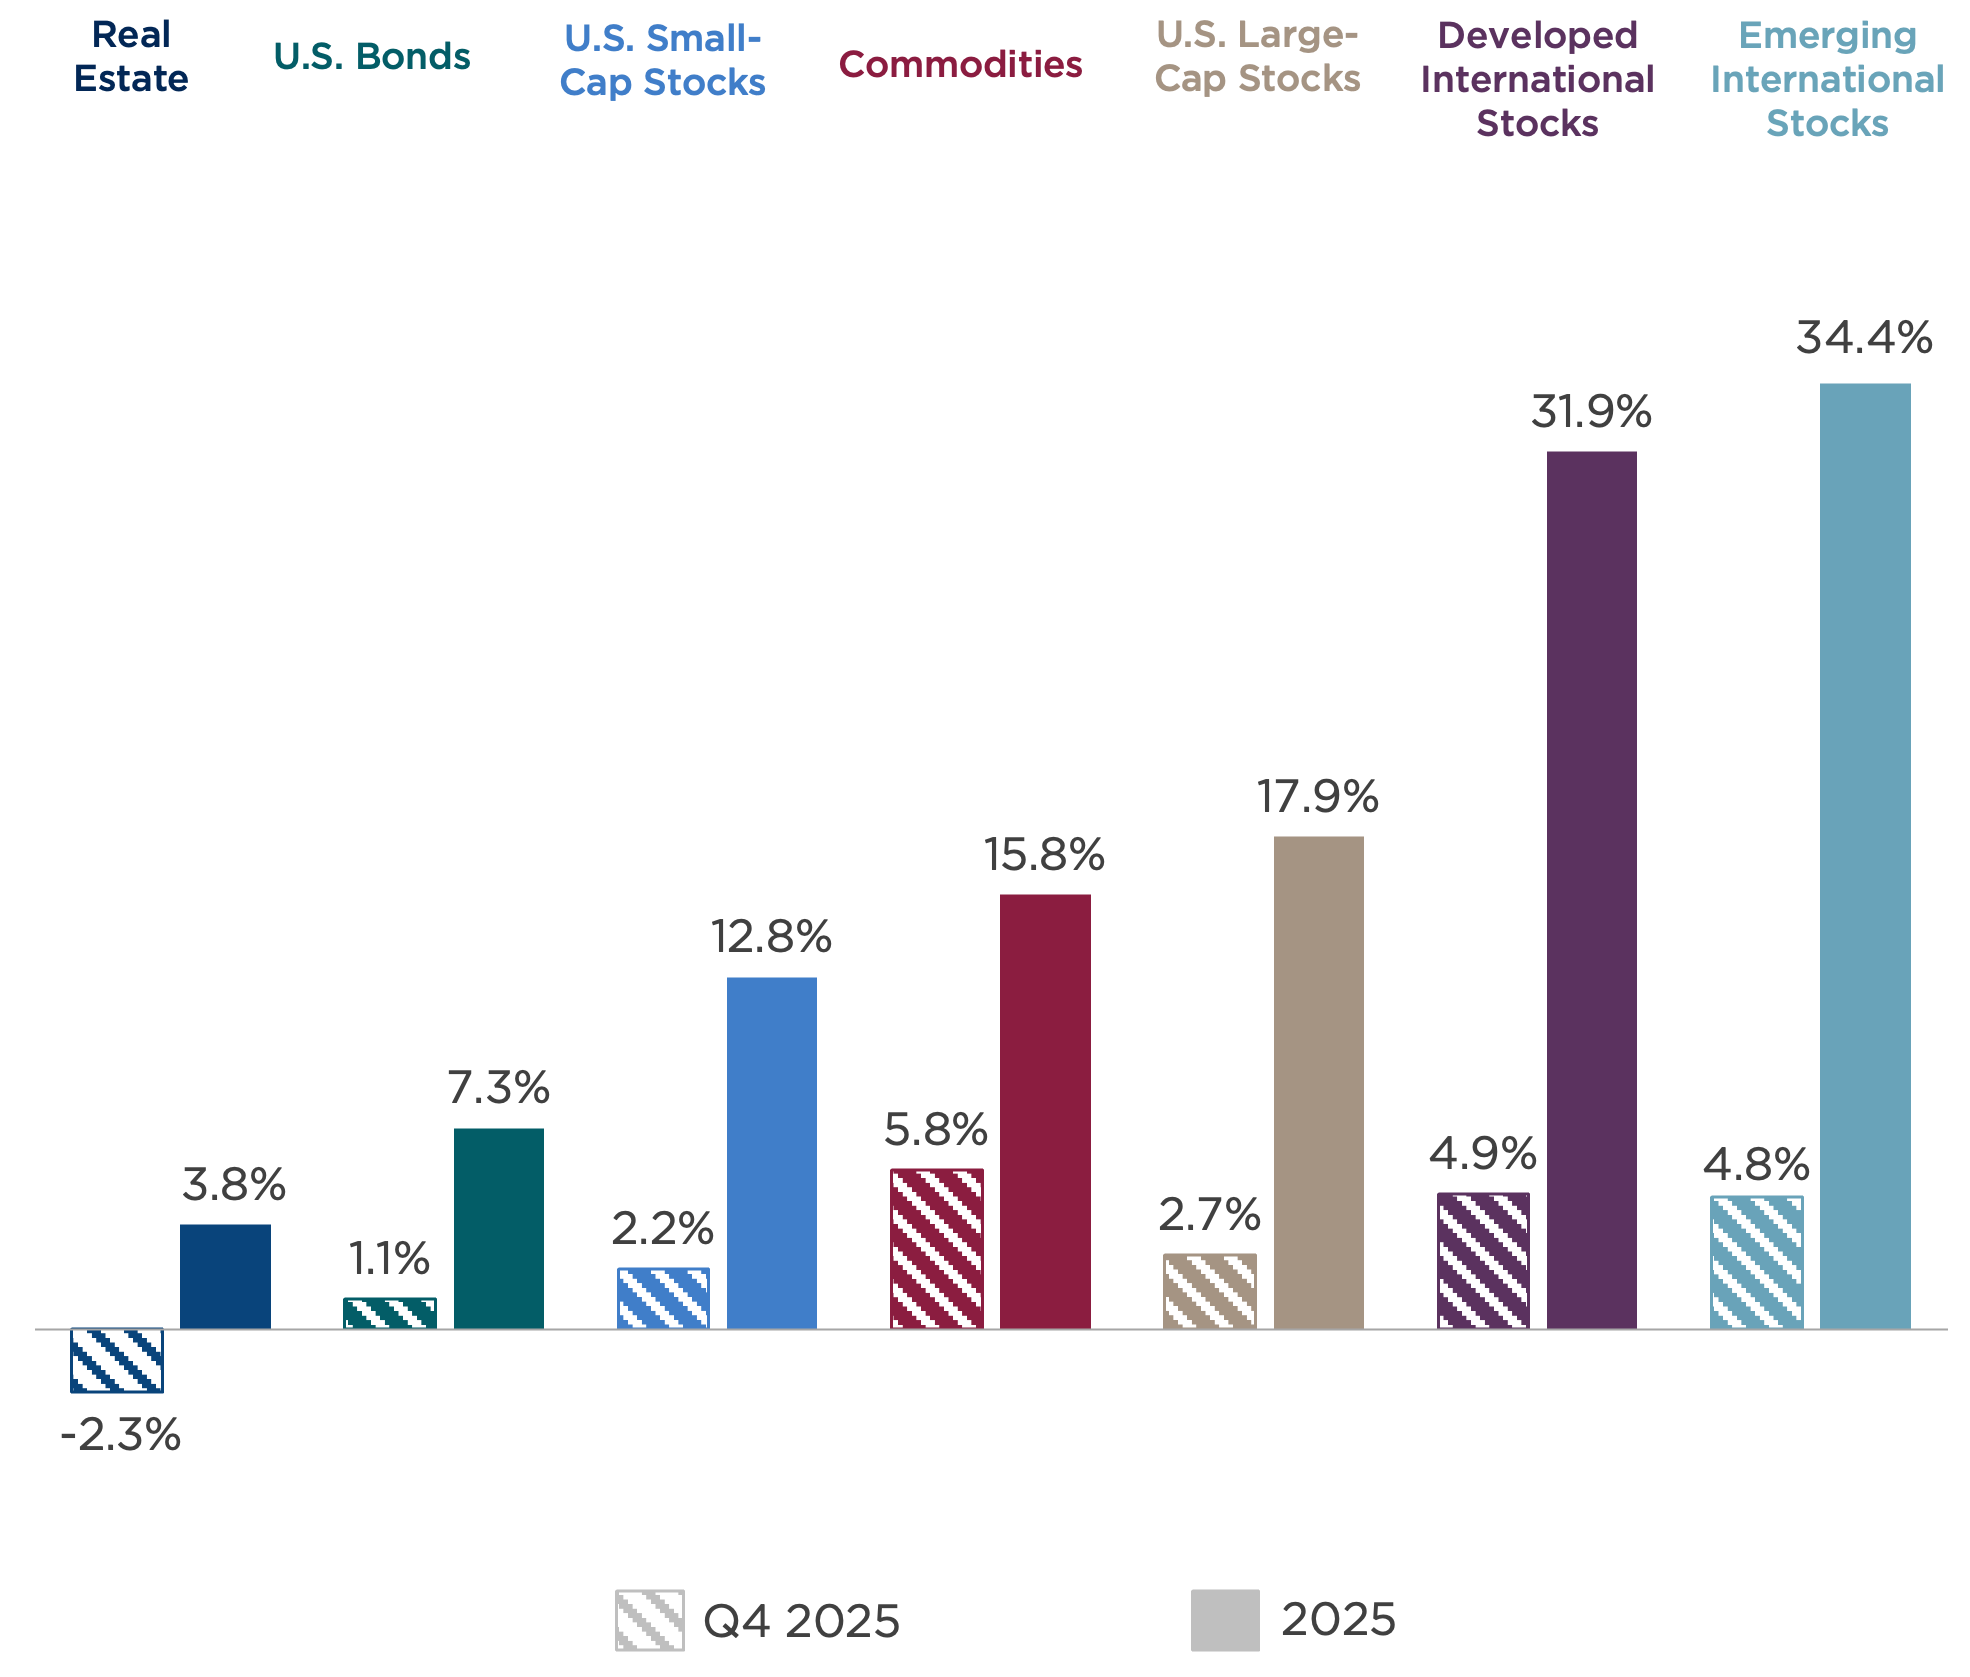
Asset class returns are represented by the following indexes: Bloomberg U.S. Aggregate Bond Index (U.S. bonds), S&P 500 Index (U.S. large-cap stocks), Russell 2000® (U.S. small-cap stocks), MSCI EAFE Index (international developed market stocks), MSCI Emerging Market Index (emerging market stocks), Dow Jones U.S. Real Estate Index (real estate), and Bloomberg Commodity Index (commodities).
International Markets Take the Lead
Developed and emerging international stocks each delivered nearly 5 percent returns in the fourth quarter, almost double that of the S&P 500 Index. Their outperformance was driven by a powerful trifecta: attractive valuations relative to high-priced U.S. stocks, a weakening U.S. dollar, and synchronized stimulus efforts abroad.
For the full year, emerging markets were the standout performer, gaining more than 34 percent, driven by strong performance from emerging Asian economies and the rise in precious and industrial metals prices, even as energy commodities lagged.
U.S. Stocks Broaden
The S&P 500 posted a modest 2.7 percent gain in the fourth quarter and a strong return of nearly 18 percent for the year. But market dynamics shifted considerably throughout 2025. The Magnificent Seven trade cooled as future earnings-growth expectations began to normalize, and more than a trillion dollars of S&P 500 market cap rotated away from the technology sector in November and December.
For the past three years, the largest tech stocks have carried the U.S. equity market on their backs, driving their price-to-earnings (P/E) multiples to elevated levels. The forward P/E multiple of the top ten S&P 500 stocks surpassed 28x at year-end—well above the full index (at 22x) and the long-term index average of 17x. At these levels, the Magnificent Seven stocks are priced for perfection.[2]
This valuation gap, plus growing optimism about the earnings-growth prospects of the broader index, helps explain the rotation we witnessed late last year. Solid economic growth conditions and upcoming stimulus promise to boost cyclical sectors. At the same time, expectations for lower interest rates and early AI-related productivity gains could improve profit margins in some corners of the markets that were largely left behind for the past three years.
Fixed Income Faces Yield Divergence
The bond market spent the fourth quarter caught in a tug-of-war between Federal Reserve rate cuts and growing fiscal anxieties.
Short-term bond yields fell after the Fed delivered its third rate cut of 2025, and the 10-year Treasury yield ticked higher as investors pondered the forward path of inflation. In the background, investors nurtured anxieties over federal debt and deficits.
This steepening of the yield curve limited gains for core bond investors, with the Bloomberg U.S. Aggregate Bond Index returning a muted 1 percent for the quarter.
Metals Move Commodities Higher
The diversified commodity index was the best performing asset class in the quarter, rising nearly 6 percent. A global manufacturing pickup boosted prices for industrial metals, but the biggest commodities return-driver continues to be the surge in precious metals.
Gold’s breakout performance, happening in tandem with strong equity returns and modest inflation, is a historical outlier. Typically, gold’s strongest returns occur when investors seek a hedge against rampant inflation, or when they lack confidence in traditional assets to produce returns. This break from the traditional stock-to-gold correlation may be a sign that investors now view gold as a hedge against not only inflation but also elevated—and seemingly accelerating—policy uncertainty.
Overall, the 2025 mosaic shows markets propelled by an AI spending theme but still uncertain of the theme’s sustainability. The global economy seems to be anticipating a jolt from fiscal and monetary stimulus but wary of the second-order effects of debt and deficits, inflation, and instability.
It’s a landscape of investors with many questions. And in their uncertainty, like high school students looking for help with homework, they’re turning to AI for answers.
AI and its Productivity Precursors
History offers a few examples of tech-driven efficiency capping inflation during times of high growth.
As shown in Figure Two, there have been four distinct periods over the past 65 years when the rate of productivity growth—that is, the amount of economic output per hour of labor— has exceeded the rate of inflation. Two of these periods (shaded gray) represent the factory automation wave of the 1960s and the digital revolution of the 1990s. In these eras, productivity grew because of increased output. The other two periods (shaded yellow) show times of productivity growth for the wrong reasons, such as a shrinking workforce in post-crisis recovery periods.
Figure Two: Labor Productivity and Core Personal Consumption Expenditure (PCE) Inflation
Year-over-year growth%, 8-quarter moving average
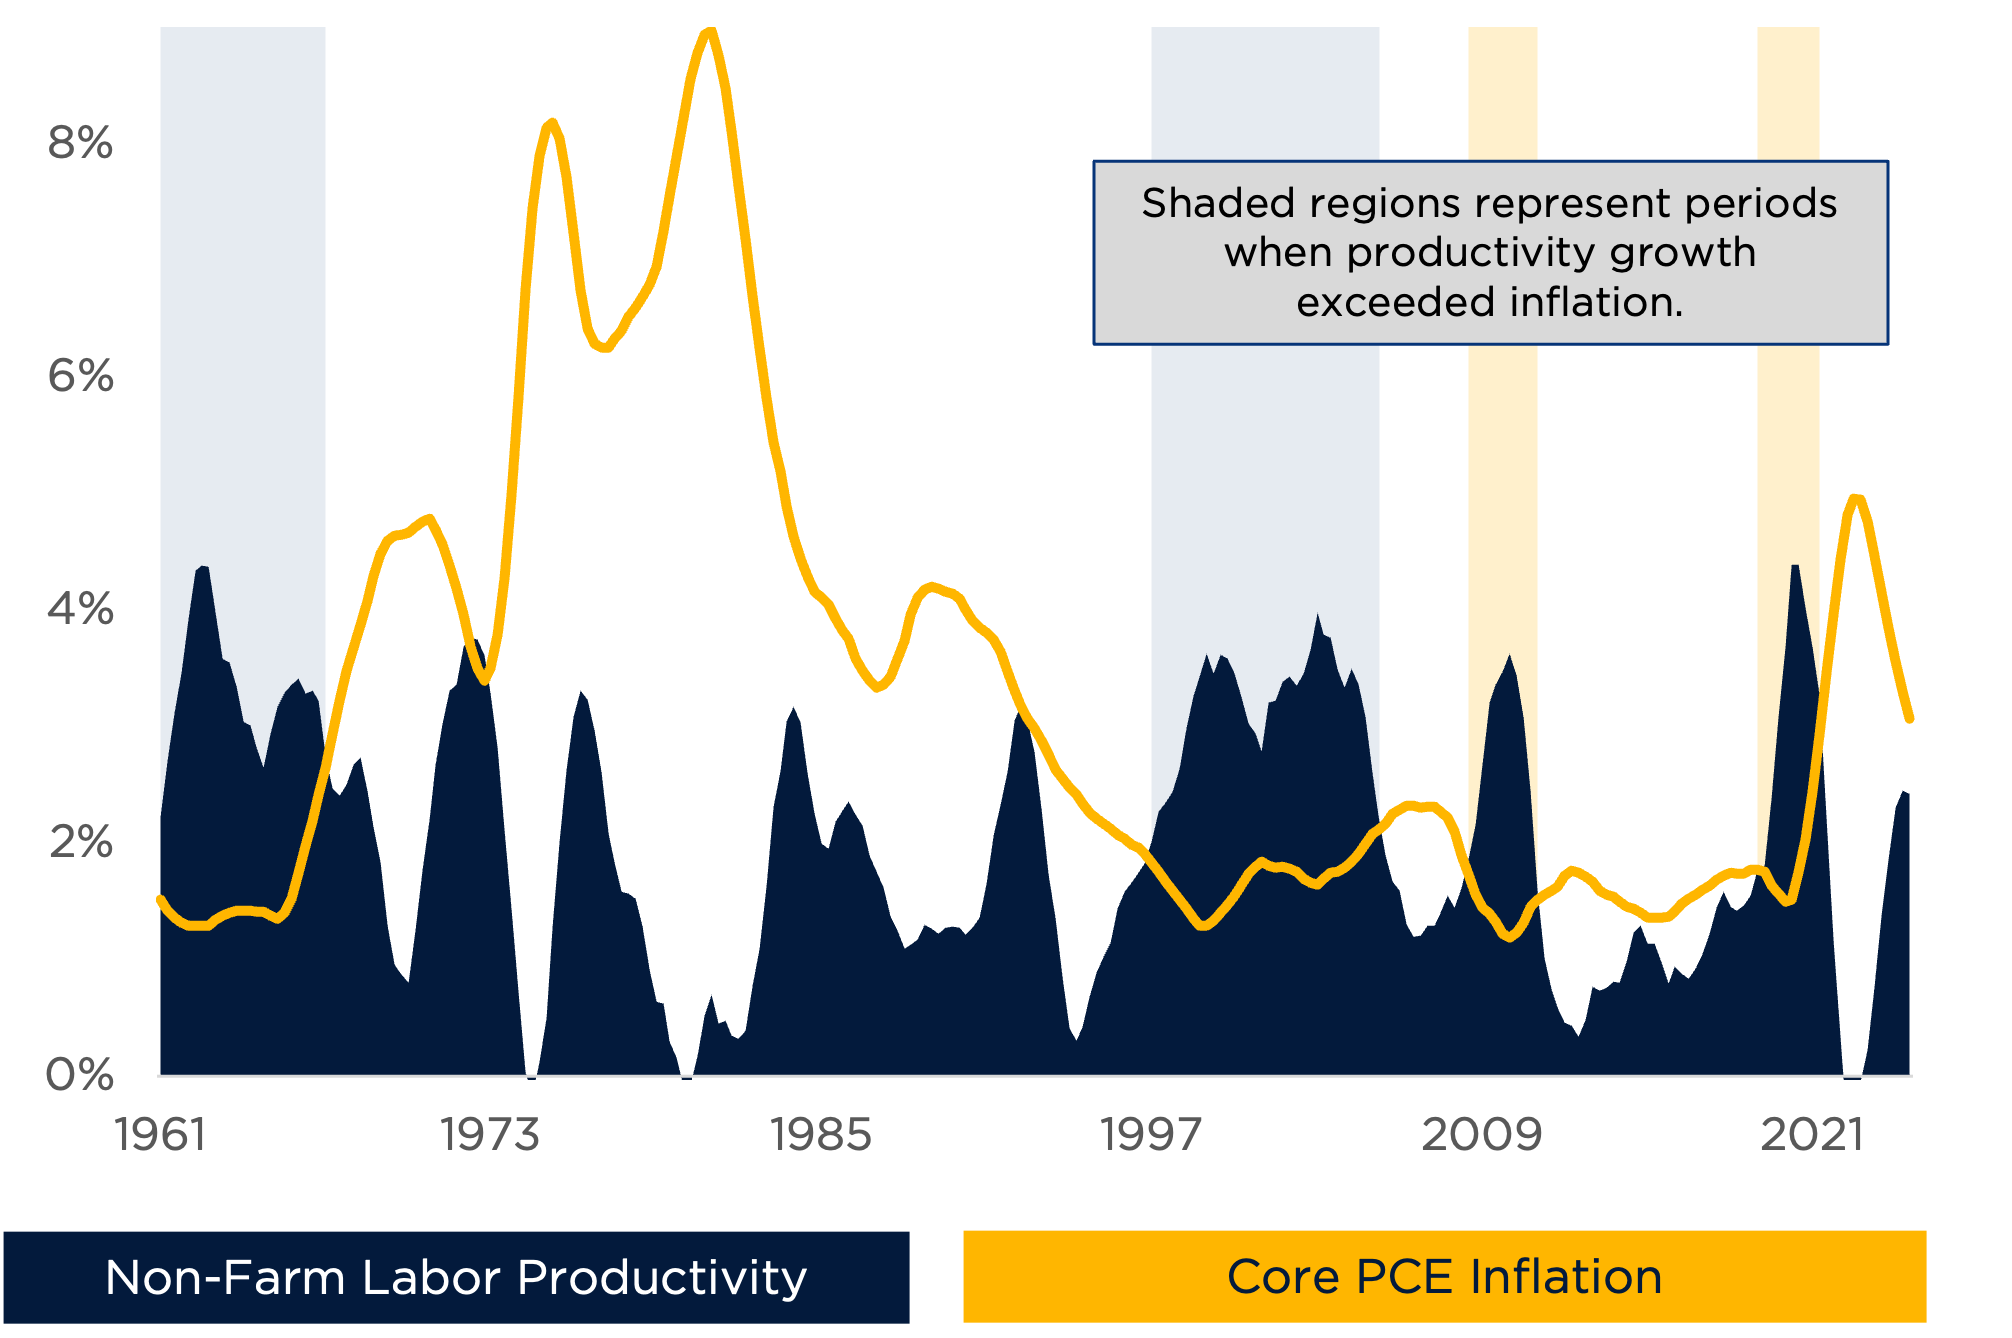
Sources: U.S. Bureau of Economic Analysis, U.S. Bureau of Labor Statistics, Federal Reserve Bank of St. Louis, CAPTRUST research
In each of these periods, Americans were openly concerned about job losses, as is true today. In the 60s, workers feared the elimination of factory jobs. In the 90s, they felt anxious about an e-commerce-driven retail apocalypse. Today, the worry centers around white-collar knowledge workers in fields from software engineering to customer service, law, and investment banking.
Yet these episodes, plus many earlier examples, show that technology advances rarely trigger mass unemployment. Instead, they reduce costs and unlock new demand, supporting disinflationary growth.
And, importantly, tech-triggered productivity gains can materialize well before the maturity of the technology itself.
Real World Examples
Consider the U.S. auto industry in the 1960s. General Motors sought to automate its Lordstown plant with the first fleet of robot welders, but the project stalled because robots could not maneuver components into place (with crowbars and rubber mallets) the way skilled human assemblers could. The robots required components to have more precise tolerances.
GM responded by demanding higher standards from its stamping plants so that its robots could perform. But the ironic result was that these tighter tolerances made even its non-automated factories far more productive, with lower defect rates. It wasn’t just the technology that drove productivity gains. It was also the precursors to implementation.[3]
We saw the same phenomenon during the software boom of the 1990s. Businesses uncovered massive inefficiencies as they prepared to shift their enterprises to single-database platforms. One famous case involved Nestlé, which realized its factories were paying 29 different prices for vanilla from the same vendor because each factory coded the ingredient differently in its fragmented legacy systems. The simple act of factory leaders coming together to standardize the names of ingredients unlocked massive bargaining power, savings, and efficiency.[4]
Today, executives anxiously await AI payoffs, but survey findings, shown in Figure Three, suggest early results are tepid at best.
Yet, if the past is prologue, the earliest gains may stem from the groundwork required for AI projects, instead of AI itself. Companies must clean and standardize their data. If a forgotten, three-year-old PDF buried in a directory contains bad information, then even the most finely tuned AI agent will deliver flawed results. But once the file is fixed, human customer-service reps also become faster and more efficient—well before the AI agents come online.
Figure Three: CFO Survey: How Has AI Affected Your Firm?
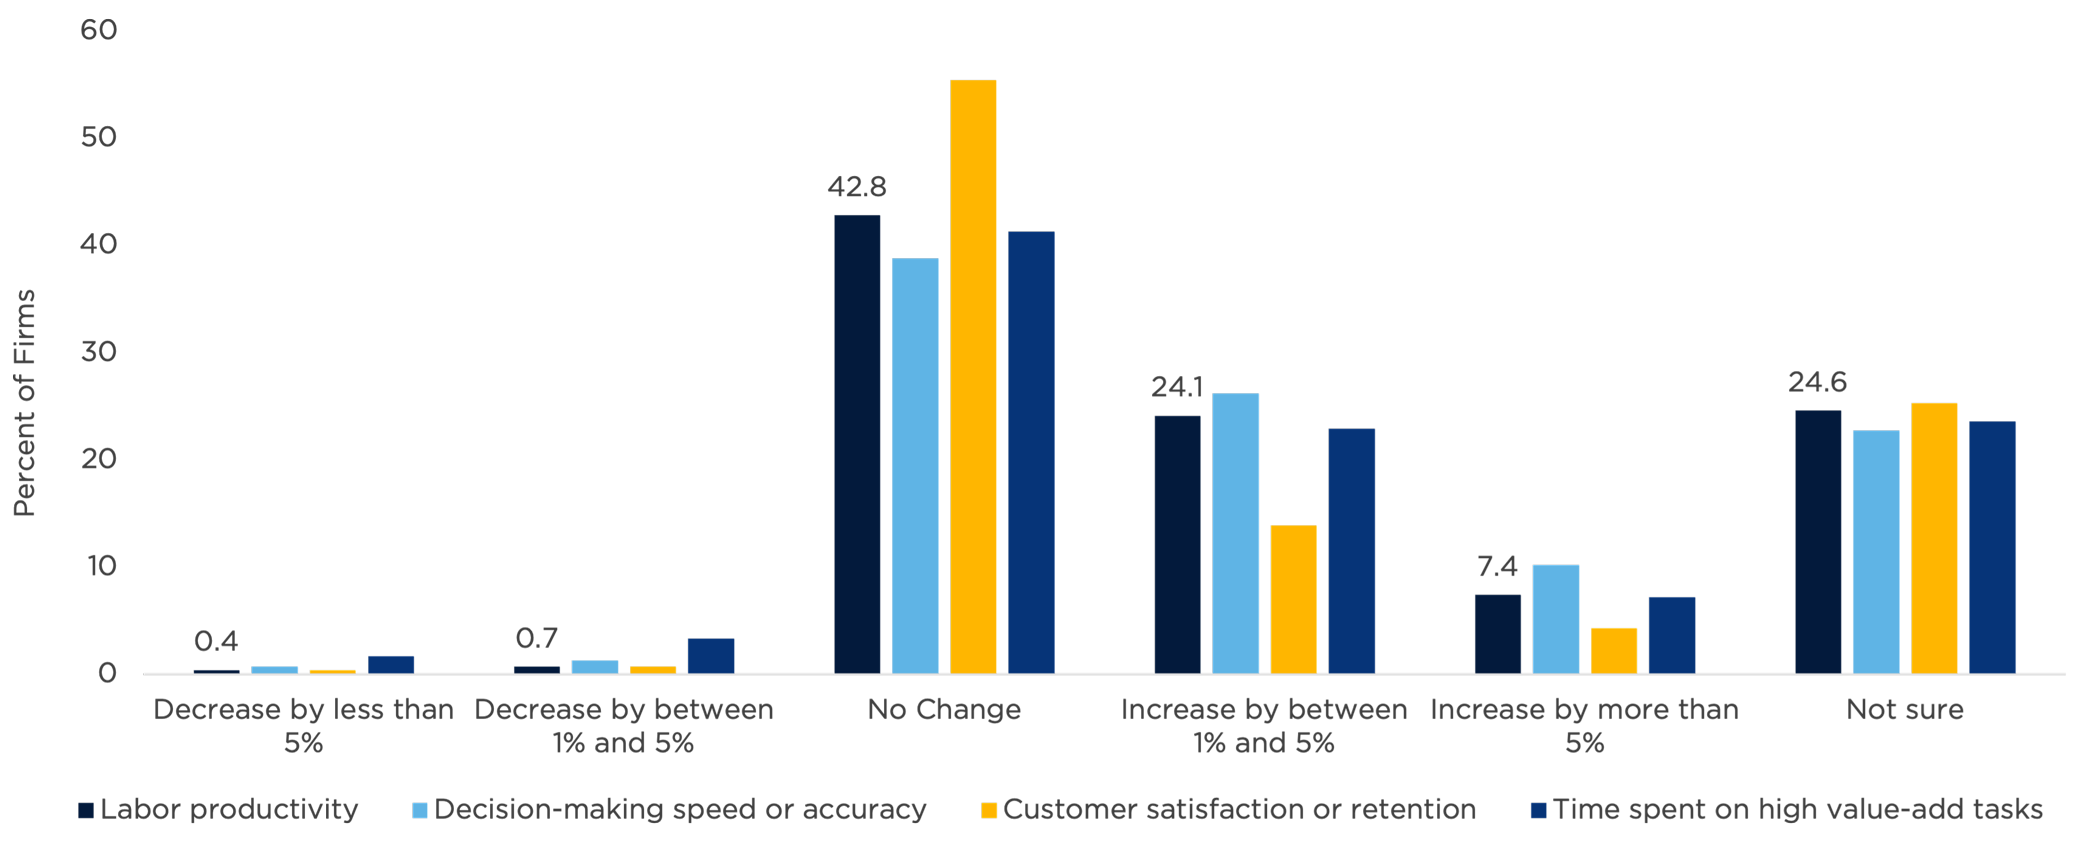
Source: “The CFO Survey – Q4 2025,” Duke University, FRB Richmond, and FRB Atlanta
2026 Outlook: Mark Your Calendars
2026 will be an eventful year of both routine happenings (like data releases and Fed meetings) and special events that will offer abundant chances for the emergence of winners and losers, whether on ski slopes, on football fields, in polling places, or in the financial markets.
Fiscal Fuel from the One Big Beautiful Bill
The One Big Beautiful Bill Act (OBBBA) sets the stage for a major injection of stimulus this year. As we head into tax season, tax code changes could release a firehose of cash to consumers, including:
- Adjustments to tax brackets;
- A child tax credit expansion;
- New deductions for people over 60; and
- The elimination of tax on overtime pay and tips.
These changes could lead to an estimated 44 percent year-over-year increase in tax refunds: a potent stimulative expected during the first half of the year.[5]
The bill also includes provisions for continued business investment and hiring, including extended 100 percent expensing for equipment and factories. These incentives align with the recent rotation we’ve seen into the industrials and materials sectors, as companies move to upgrade their physical and digital infrastructures.
Federal Reserve: Rate Relief or Regret?
The Federal Reserve is walking a high-stakes tightrope strung between two competing risks. On one side is the risk of a hiring slowdown and weakening consumers. On the other is the risk of still-elevated inflation with potentially significant government stimulus in the months ahead.
In 2025, investors and economists scrutinized labor market data for signs of weakness. And as usual, people found what they sought. Monetary doves advocating for faster and larger rate cuts bemoaned monthly payroll gains that slowed significantly throughout the year.
But those advocating for rate-cut patience view this data differently, pointing to the structural shift that occurred within the labor market this year: a sharp decline in net immigration. In a low-immigration economy with a low and falling birth rate, the break-even number of jobs required to keep unemployment stable is no longer as high as what we’ve become accustomed to. [6]
With strong economic growth, a stable labor market, low unemployment, and inflation that remains well-above-trend, Fed hawks and those advocating for patience have reasons for pause.
This tension is set to escalate in 2026 as political pressures reach a boiling point. Recent DOJ subpoenas served to Fed Chair Jerome Powell—just months before his term expires on May 15—have injected additional uncertainty. The President is expected to announce a successor in the next few months, and that person’s Senate confirmation process could be a contentious referendum on the Fed’s independence.[7]
Nonetheless, market expectations for rate cuts continue to show gradual easing throughout this year, with futures markets pricing in a gentle glide toward 3 percent by early 2027.
Consumer strength will likely play a role. The stark difference in spending behavior between wealthier households and those owning assets (such as homes and investment portfolios) compared to those with lower incomes and few assets continues to widen. The gap could create a potent political dynamic as we head toward midterm elections.
Midterm Uncertainty
No 2026 outlook would be complete without mentioning the midterm elections. Historically, midterm years exhibit higher volatility and lower returns than the other years of the political cycle, with an average intra-year S&P 500 drawdown of 19 percent. However, this volatility is often followed by recovery once election uncertainty resolves—regardless of the winning party. In fact, since 1950, the S&P 500 has shown a consistent track record of positive returns in the 12 months following a midterm election.[8]
A split-congress result could increase legislative gridlock and slow the pace of policy shifts, creating a more stable environment, which corporate decision-makers and markets often favor.
From Promise to Proof
The global economy has proved remarkably resilient to policy volatility that may have ordinarily derailed financial markets, including the radical reset of global trade, a structural shock to the labor market, escalating threats to Federal Reserve independence, and a continued fracturing of global relationships.
Yet one powerful force propelled markets through this noise to deliver a third consecutive year of exceptional gains: the unprecedented AI infrastructure investment cycle.
The size of the actors involved—and the sheer dollar magnitude of spending—transformed the AI theme into a form of direct, private-sector economic stimulus. But as we enter the show-me phase of the AI revolution, the staying power of this tailwind is in question.
Taken together, these factors suggest the year ahead could be noisy. But for long-term investors, what matters most is the strength of the underlying economy.
Corporate earnings growth expectations are healthy and broadening, and consumers continue spending. The broadening of market strength is a step in the right direction toward a less fragile market. And if AI can deliver on its promise of disinflationary growth, rising productivity has shown to be a force that can grow economies past a wide range of challenges and noise.
[1] “About 1 in 5 U.S. Workers Now Use AI in Their Job, Up Since Last Year,” Pew Research Center, October 6, 2025.
[2] J.P. Morgan, data as of 12/31/2025
[3] The Machine that Changed the World, Womack, James P., Daniel T. Jones, and Daniel Roos
[4] “Nestlé’s Enterprise Resource Planning (ERP) Odyssey,” Worthen, Ben, CIO Magazine, May 15, 2002
[5] Strategas
[6] “Economic Issues to Watch in 2026,” Brookings Institution, Jan. 13, 2026
[7] “Statement from Federal Reserve Chair Jerome H. Powell,” Federal Reserve Board, Jan. 11, 2026
[8] Strategas
Investment advisory services offered by CapFinancial Partners, LLC (“CAPTRUST” or “CAPTRUST Financial Advisors”), an investment advisor registered under The Investment Advisers Act of 1940. This material is intended to be informational only and does not constitute legal, accounting, or tax advice. Please consult the appropriate legal, accounting, or tax advisor if you require such advice. The opinions expressed in this report are subject to change without notice. This material has been prepared or is distributed solely for informational purposes. It may not apply to all investors or all situations and is not a solicitation or an offer to buy any security or instrument or to participate in any trading strategy. The information and statistics in this report are from sources believed to be reliable but are not guaranteed by CAPTRUST Financial Advisors to be accurate or complete. All publication rights reserved. None of the material in this publication may be reproduced in any form without the express written permission of CAPTRUST: 919.870.6822. © 2026 CAPTRUST Financial Advisors.
Index Definitions
Indexes are unmanaged, do not incur management fees, costs, and expenses, and cannot be invested in directly.
S&P 500® Index: Measures the performance of 500 leading publicly traded U.S. companies from a broad range of industries. It is a float-adjusted market-capitalization weighted index. Russell 2000® Index: Measures the performance of the 2,000 smallest companies in the Russell 3000® Index. It is a market-capitalization weighted index.
MSCI EAFE Index: Measures the performance of the large- and mid-cap equity market across 21 developed markets around the world, excluding the U.S. and Canada. It is a free float-adjusted market-capitalization weighted index.
Bloomberg U.S. Intermediate Govt/Credit Bond Index: Measures the performance of the non-securitized component of the U.S. Aggregate Index. It includes investment-grade, US Dollar-Denominated, fixed-rate Treasuries, government-related corporate securities. It is a market-value weighted index.
Bloomberg Commodity Index (BCOM): Measures the performance of 24 exchange-traded futures on physical commodities which are weighted to account for economic significance and market liquidity. BCOM provides broad-based exposure to commodities without a single commodity or commodity sector dominating the index.
MSCI Emerging Markets Index: Measures the performance of large and mid-cap stocks across 24 Emerging Markets countries. It aims to capture the performance of equity markets in emerging economies worldwide and covers approximately 85 percent of the free float-adjusted market capitalization in each country.